Transcription of BERKSHIRE HATHAWAY INC.
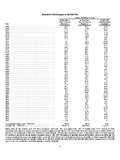
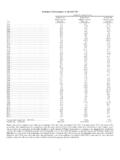
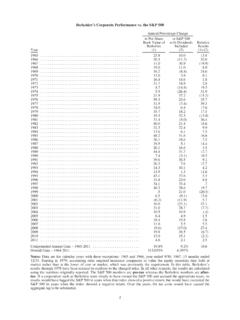
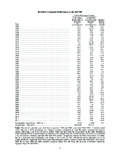
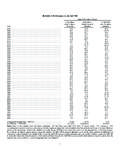
1 BERKSHIRE 's Corporate Performance vs. the S&P 500. Annual Percentage Change in Per-Share in S&P 500. Book Value of with Dividends Relative BERKSHIRE Included Results Year (1) (2) (1)-(2). 1965 .. 1966 .. ( ) 1967 .. ( ). 1968 .. 1969 .. ( ) 1970 .. 1971 .. 1972 .. 1973 .. ( ) 1974 .. ( ) 1975 .. ( ). 1976 .. 1977 .. ( ) 1978 .. 1979 .. 1980 .. ( ). 1981 .. ( ) 1982 .. 1983 .. 1984 .. 1985 .. 1986 .. 1987 .. 1988 .. 1989 .. 1990 .. ( ) 1991 .. 1992 .. 1993 .. 1994 .. 1995 .. 1996 .. 1997 ..7. 1998 .. 1999 ..5 ( ). 2000 .. ( ) 2001 .. ( ) ( ) 2002 .. ( ) 2003 .. ( ). 2004.
2 (.4). 2005 .. 2006 .. 2007 .. 2008 .. ( ) ( ) 2009 .. ( ). Compounded Annual Gain 1965-2009 .. Overall Gain 1964-2009 .. 434,057% 5,430%. Notes: Data are for calendar years with these exceptions: 1965 and 1966, year ended 9/30; 1967, 15 months ended 12/31. Starting in 1979, accounting rules required insurance companies to value the equity securities they hold at market rather than at the lower of cost or market, which was previously the requirement. In this table, BERKSHIRE 's results through 1978 have been restated to conform to the changed rules. In all other respects, the results are calculated using the numbers originally reported.
3 The S&P 500 numbers are pre-tax whereas the BERKSHIRE numbers are after-tax. If a corporation such as BERKSHIRE were simply to have owned the S&P 500 and accrued the appropriate taxes, its results would have lagged the S&P 500. in years when that index showed a positive return, but would have exceeded the S&P 500 in years when the index showed a negative return. Over the years, the tax costs would have caused the aggregate lag to be substantial. 2. BERKSHIRE HATHAWAY INC. To the Shareholders of BERKSHIRE HATHAWAY Inc.: Our gain in net worth during 2009 was $ billion, which increased the per-share book value of both our Class A and Class B stock by Over the last 45 years (that is, since present management took over).
4 Book value has grown from $19 to $84,487, a rate of compounded annually.*. BERKSHIRE 's recent acquisition of Burlington Northern Santa Fe (BNSF) has added at least 65,000. shareholders to the 500,000 or so already on our books. It's important to Charlie Munger, my long-time partner, and me that all of our owners understand BERKSHIRE 's operations, goals, limitations and culture. In each annual report, consequently, we restate the economic principles that guide us. This year these principles appear on pages 89-94 and I urge all of you but particularly our new shareholders to read them.
5 BERKSHIRE has adhered to these principles for decades and will continue to do so long after I'm gone. In this letter we will also review some of the basics of our business, hoping to provide both a freshman orientation session for our BNSF newcomers and a refresher course for BERKSHIRE veterans. How We Measure Ourselves Our metrics for evaluating our managerial performance are displayed on the facing page. From the start, Charlie and I have believed in having a rational and unbending standard for measuring what we have or have not accomplished. That keeps us from the temptation of seeing where the arrow of performance lands and then painting the bull's eye around it.
6 Selecting the S&P 500 as our bogey was an easy choice because our shareholders, at virtually no cost, can match its performance by holding an index fund. Why should they pay us for merely duplicating that result? A more difficult decision for us was how to measure the progress of BERKSHIRE versus the S&P. There are good arguments for simply using the change in our stock price. Over an extended period of time, in fact, that is the best test. But year-to-year market prices can be extraordinarily erratic. Even evaluations covering as long as a decade can be greatly distorted by foolishly high or low prices at the beginning or end of the measurement period.
7 Steve Ballmer, of Microsoft, and Jeff Immelt, of GE, can tell you about that problem, suffering as they do from the nosebleed prices at which their stocks traded when they were handed the managerial baton. The ideal standard for measuring our yearly progress would be the change in BERKSHIRE 's per-share intrinsic value. Alas, that value cannot be calculated with anything close to precision, so we instead use a crude proxy for it: per-share book value. Relying on this yardstick has its shortcomings, which we discuss on pages 92 and 93. Additionally, book value at most companies understates intrinsic value, and that is certainly the case at BERKSHIRE .
8 In aggregate, our businesses are worth considerably more than the values at which they are carried on our books. In our all-important insurance business, moreover, the difference is huge. Even so, Charlie and I. believe that our book value understated though it is supplies the most useful tracking device for changes in intrinsic value. By this measurement, as the opening paragraph of this letter states, our book value since the start of fiscal 1965 has grown at a rate of compounded annually. *All per-share figures used in this report apply to BERKSHIRE 's A shares. Figures for the B shares are 1/1500th of those shown for A.
9 3. We should note that had we instead chosen market prices as our yardstick, BERKSHIRE 's results would look better, showing a gain since the start of fiscal 1965 of 22% compounded annually. Surprisingly, this modest difference in annual compounding rate leads to an 801,516% market-value gain for the entire 45-year period compared to the book-value gain of 434,057% (shown on page 2). Our market gain is better because in 1965. BERKSHIRE shares sold at an appropriate discount to the book value of its underearning textile assets, whereas today BERKSHIRE shares regularly sell at a premium to the accounting values of its first-class businesses.
10 Summed up, the table on page 2 conveys three messages, two positive and one hugely negative. First, we have never had any five-year period beginning with 1965-69 and ending with 2005-09 and there have been 41 of these during which our gain in book value did not exceed the S&P's gain. Second, though we have lagged the S&P in some years that were positive for the market, we have consistently done better than the S&P in the eleven years during which it delivered negative results. In other words, our defense has been better than our offense, and that's likely to continue.