Transcription of Boiler Calculations - KTH
1 Helsinki University of Technology Department of Mechanical Engineering Energy Engineering and Environmental Protection Publications Steam Boiler Technology eBook Espoo 2002 Boiler Calculations Sebastian Teir, Antto Kulla Helsinki University of Technology Department of Mechanical Engineering Energy Engineering and Environmental Protection iiTable of contents Steam/water diagrams used in Boiler Calculations ..1 Temperature-heat (T-Q) 1 Temperature-entropy (T-s) 2 Pressure-enthalpy (p-h) diagram.
2 3 Enthalpy-entropy (Mollier, h-s) diagram ..4 Determination of steam/water parameters .. 5 Given parameters .. 5 Pressure 5 Procedure for determination of specific enthalpies and mass flow rates .. 6 Superheaters and 7 Spray water group mass 7 Calculations of heat 8 Evaporator .. 8 9 Reheater .. 9 Economizer .. 9 Air preheater .. 9 Determination of Boiler efficiency .. 10 Standards .. 10 Major heat 10 Heat loss with unburned combustible gases .. 10 Heat loss due to unburned solid fuel .. 10 Heat loss due to wasted heat in flue gases.
3 11 Heat loss due to wasted heat in ashes .. 11 Losses due to heat transfer (radiation) to the environment .. 12 Losses of blowdown, sootblowing and atomizing 12 Internal power 12 Calculating Boiler efficiency .. 12 Direct 13 Indirect method .. 13 References .. 14 1 Steam/water diagrams used in Boiler Calculations Temperature-heat (T-Q) diagram The T-Q diagram is a useful tool for designing heat exchangers. It can also be used to present the heat transfer characteristics of an existing heat exchanger or heat exchanger network.
4 The T-Q diagram consists of two axes: The current stream temperature on the y-axis and the amount of heat transferred on the x-axis. Sometimes the streams are marked with arrowheads to clarify the direction of the streams, but these are not necessary: since heat cannot move from the colder stream to the hotter stream according to the second law of thermodynamics, the directions of the streams are explicitly determined: The hot stream transfers its heat to the cold stream, thus the flow direction of the hot stream is towards lower temperature and the flow direction of the cold stream is towards higher temperatures.
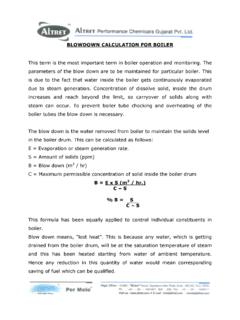
5 For the same reason, the hot stream is always above the cold stream in the T-Q diagram (figure 1). Figure 1: Examples of T-Q diagrams for a parallel flow heat exchanger (left), and a counter (or cross) flow heat exchanger (middle). The hot stream is marked with red color and the cold with blue color. When designing or reviewing heat exchanger networks, the T-Q diagram gets useful. The T-Q diagram is therefore applied when designing boilers; especially the heat exchanger surface arrangement can be clearly visualized with a T-Q diagram (figure 2).
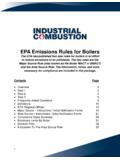
6 020040060080010001200140016000 %10 %20 %30 %40 %50 %60 %70 %80 %90 %100 %Share of heat load [%]Temperature [ C]Flue gas streamWater/steam streamAir streamFurnaceSuperheaterEconomizerAir preheater Figure 2: Example of a T-Q diagram representing the heat surfaces in a PCF Boiler . 2 Temperature-entropy (T-s) diagram The T-s diagram represents the various phases of steam/water with temperature as a function of the specific entropy. It is often used to visualize steam power processes. The T-s diagram is also commonly used for displaying reversible processes (or real processes simplified as reversible processes), which in the T-s diagram appear as closed curves (loop).
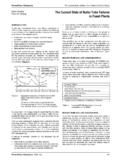
7 The left border, up to the critical point, is the border where the liquid is saturated (figure 3). That is, the water is still liquid and contains no steam. But if we go further right (increase the entropy), steam bubbles starts to form in the water. In other words, saturated water starts to boil when heat is added and entropy is increased. The enclosed region in the middle is the region where water is a mixture of vapor and liquid. Steam that contains water in any form, either as minute droplets, mist or fog, is called wet steam.
8 The quantity called x in the diagram Critical pointp = constantp = constantp = constantp = constantv = constantv = constantLiquid-vapour regionSaturated vapourSaturated liquidX = 0,2X = 0,9 TemperatureEntropy Figure 3: Simplified T-s diagram of steam/water. represents the amount (percentage by weight) of dry vapor in the wet steam mixture. This quantity is called the quality of steam. For instance, if there is 10 % moisture in the steam, the quality of the steam is 90 % or 0,9.
9 The temperature of wet steam is the same as dry saturated steam at the same pressure. The right border, down from the critical point, is the line where steam is saturated. When steam is heated beyond that border, steam is called superheated. Water boils under constant temperature and pressure, so a horizontal line inside the enclosed region represents a vaporization process in the T-s diagram. The steam/water heating process in the Boiler represented by the diagram in figure 2 can also be drawn in a T-s diagram (figure 4), if the Boiler pressure is assumed to be 10 MPa.
10 3 Figure 4: Detailed T-s diagram of the PCF Boiler steam/water heating process from figure 2 (note: color of the steam/water process line is changed from blue to red). Pressure-enthalpy (p-h) diagram Another tool used in Boiler calculation is the pressure-enthalpy diagram for steam/water (figure 5). With the p-h diagram it is easy to visualize the partial shares of the total heat load on different heat exchanger surfaces in the Boiler : drawing the steam heating process in the Boiler onto the p-h diagram will give a horizontal line (if we simplify the process and set pressure losses to zero).