Transcription of Bottlenecks: Causes and macroeconomic implications
1 BIS Bulletin No 48 Bottlenecks: Causes and macroeconomic implications Daniel Rees and Phurichai Rungcharoenkitkul 11 November 2021 BIS Bulletins are written by staff members of the Bank for International Settlements, and from time to time by other economists, and are published by the Bank. The papers are on subjects of topical interest and are technical in character. The views expressed in them are those of their authors and not necessarily the views of the BIS. The authors are grateful to Alessandro Barbera for excellent analysis and research assistance, and to Louisa Wagner for administrative support. The editor of the BIS Bulletin series is Hyun Song Shin. This publication is available on the BIS website ( ). Bank for International Settlements 2021. All rights reserved. Brief excerpts may be reproduced or translated provided the source is stated.
2 ISSN: 2708-0420 (online) ISBN: 978-92-9259-519-7 (online)BIS Bulletin 1 Daniel Causes and macroeconomic implications Key takeaways Bottlenecks in the supply of commodities, intermediate goods and freight transport have given rise to volatile prices and delivery delays. Bottlenecks started out as pandemic-related supply disruptions amid strong demand from the global economic recovery. But they have been aggravated by the attempts of supply chain participants to build buffers in already lean production networks so-called bullwhip effects. Bottlenecks have been particularly severe in upstream industries ie those that supply inputs used in many other products. These constraints have led to large international spillovers through global value chains. The direct inflationary effect of bottlenecks will likely be limited after relative prices have adjusted.
3 However, sustained inflationary pressures could emerge if bottlenecks persist long enough to trigger an upward shift in wage growth and inflation As the global recovery gains traction, demand for key raw materials, intermediate inputs and logistical services has outstripped available supply, leading to rising and volatile prices, and delivery delays. The resulting mismatches have put supply chains under pressure, causing bottlenecks that arise when the demand for an upstream production input suddenly and significantly exceeds the maximum amount that can be produced and delivered. Current bottlenecks have persisted longer than anticipated, weighed on output growth and helped to raise global inflation. This Bulletin outlines the sectors subject to bottlenecks, investigates their Causes and assesses their macroeconomic implications . Where have bottlenecks emerged?
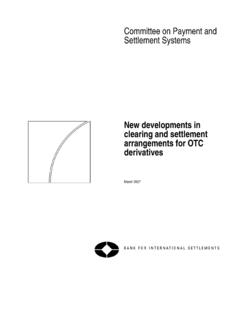
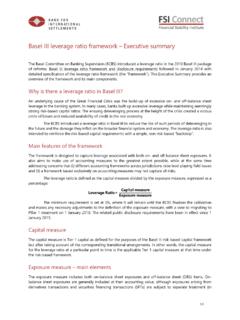
4 Recent bottlenecks have been most severe in raw materials, intermediate manufactured goods and freight transport. For raw materials, prices rose sharply as shortages emerged and firms scrambled to secure supplies, followed in several cases by sudden price declines as production ramped up or demand ebbed (Graph 1, first panel). In the manufacturing sector, prices have increased substantially for certain computer chips in high demand, forcing some customers to pause production and others to build precautionary stockpiles to maintain production. Meanwhile, shipping costs have shot up for trade between Asia and North America (second panel) and delivery times have lengthened. Ships have been forced to queue for days to access ports, clogging distribution across the supply chain. Truck and air freight prices have also soared, exacerbated by labour shortages.
5 2 BIS Bulletin These bottlenecks have had knock-on effects through production networks. Unable to secure inputs, firms slowed or stopped production, causing order backlogs and blowing out delivery times (Graph 1, third panel). At the retail level, goods inventories have sunk to historic lows, particularly for durable items such as cars and furniture with high transport costs (fourth panel). In several countries, energy inventories are also at record lows, leading to blackouts and rationing. These, in turn, have weighed on production of raw materials and manufactured goods, intensifying bottlenecks further. Why have bottlenecks appeared and why are they so severe? Pandemic-induced supply disruptions have clearly been a major cause of bottlenecks, especially in the early stages of the global recovery. Producers who had severed relationships with suppliers early in the pandemic found it hard to re-establish them when demand picked up.
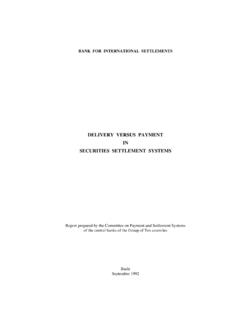
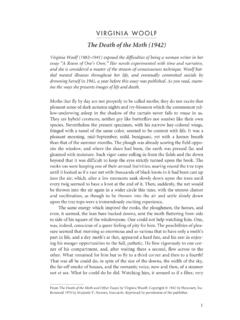
6 Asynchronous lockdowns disrupted shipping, while sporadic virus outbreaks led to further dislocations. But there are also other Causes . Unexpected natural events have intensified supply pressures. A lack of investment in the years leading up to the pandemic left some industries with little spare capacity. The investment shortfall was particularly severe for oil and resource commodities, due in part to the transition away from fossil fuel energy. At the same time, rising prices for some items went hand in hand with high volumes, suggesting an important role for demand. Prices for many resource commodities surged against a backdrop of stable supply at least in aggregate which was hardly affected by the pandemic (Graph 2, left-hand panel). And semiconductor exports from Asia considerably exceed the 2019 level (centre panel), in part reflecting trend increases in demand for IT and electronics goods.
7 Meanwhile, ports in the United States and China have been processing a larger volume of shipping containers than pre-pandemic, albeit with considerable month-to-month volatility (right-hand panel). Bottlenecks reflected in prices and quantities Graph 1 Volatile commodity prices Rising shipping costs4 Delivery times blow out, backlogs up Goods inventories squeezed Jan 2020 = 100 USD, 000s Diffusion index5 Ratio Ratio 1 In US dollars/barrel. 2 Generic first futures price, coking coal on Dalian Commodity Exchange. 3 Generic first futures price, random length lumber. 4 Freightos Baltic daily containerised freight rate index. Seven-day moving average. 5 A value of 50 indicates that the number of firms reporting improvement is the same as the number reporting deterioration.
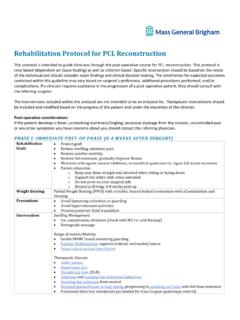
8 6 Delivery times displayed on an inverted : Federal Reserve Bank of St. Louis, FRED; Bloomberg; Datastream; IHS Markit; BIS calculations. 5004003002001000900700500300100 10020202018 Oil (Brent)1 Coal2 Lumber3 Lhs:EA natural gasRhs:2016128402021202020192018 GlobalChina to North AmericaAmericaNorth Europe to North605550454035202120192017 Suppliers delivery times6 Backlogs of workGlobal business (lhs)Automotive (rhs)US inventory-to-sales ratios: BIS Bulletin 3 Several factors have amplified the economic severity of bottlenecks. One is the shift in the composition of demand towards manufactured goods during the Covid recession and recovery. These goods are heavily reliant on inputs from other industries, leading to larger demand spillovers than from a services-led recovery (Graph 3, left-hand panel).1 Manufactured goods (and their inputs) also tend to be relatively capital-intensive, making their short-run supply elasticity low as it takes time to expand productive capacity (centre panel).
9 As a result, sudden increases in manufactured goods demand can translate quickly into bottlenecks, leading to higher inflation (right-hand panel). A second factor is behavioural change on the part of supply chain participants. Anticipation of product shortages and precautionary hoarding at different stages of supply chain have aggravated initial shortages (the bullwhip effect ), leading to further incentives to build buffers. These behavioural changes have the potential to lead to feedback effects that exacerbate bottlenecks. In this respect, there are parallels between supply chain disruptions and the liquidity stresses in financial A third important background element is the lean structure of supply chains, which have prioritised efficiency over resilience in recent decades. These intricate networks of production and logistics were a virtue in normal times, but have become a shock propagator during the pandemic.
10 Once dislocations emerged, the complexity of supply chains made them hard to repair, leading to persistent mismatches between demand and supply. Nevertheless, persistent bottlenecks could also prompt corrective behavioural changes over time, eg by providing incentives for investment to expand capacity. Once bottlenecks begin to ease, the feedback loops could operate as a virtuous circle to mitigate the bullwhip effects. In this way, just as bottlenecks have persisted longer than initially expected, their resolution could also follow more swiftly than currently feared. 1 For details of the modelling exercise underlying Graph 3, please see the Online Appendix accompanying this Bulletin. 2 For a discussion , see Aramonte et al (2021). Supply struggling to keep pace with demand Graph 2 Raw materials supply rebounded quickly Semiconductor exports ramping up Container volumes top pre-pandemic level 000s tonnes 000s tonnes Tonnes 2019 mean = 100 Sources: CPT Single Window; Korea Customs Service; United States Department of Transportation; Bloomberg; CEIC; Refinitiv Eikon; BIScalculations.