Transcription of Breakdown and Reliability Analysis in a Process Industry
1 International Journal of Engineering Trends and Technology (IJETT) Volume 28 Number 3 - October 2015. Breakdown and Reliability Analysis in a Process Industry Dibyojyoti Deka1, Nath2. 1. Masters in Production & Industrial Engg, JorhatEngg. College 2. Associate Professor, Mechanical Engg. College Abstract- The complex nature of modern equipment OEE: Overall Equipment Effectiveness. and systems often lead to failures and as a RCA: Root cause Analysis . consequence lead to increase in machine downtime0 PM: Preventive Maintenance. CDF: Cumulative distribution function. thus affecting production. The failures of machineries K-S: Kolmogorov-Smirnov. cause disruptions in production resulting in a loss of availability of the system .This further increases the I. INTRODUCTION. cost of maintenance. TPM has been proved as a In most cases machine operators fail to detect the successful tool for increasing the OEE of machineries actual causes behind any problem whenever a failure by using simple effective techniques.
2 Initially in this occurs. They are often seen treating the symptoms study Pareto Analysis was used to figure out the major rather than eliminating the problem at the grass root level. This further elevates the problem to a whole contributors towards downtime losses. RCA using the new level which would have otherwise not occurred Why-Why technique was done so as to explain the had it been treated correctly in the first place. An in reasons behind equipment Breakdown . This helped in depth Analysis together with experience and training developing a PM schedule for the machines. only prepares an individual for proper handling of Reliability is an important parameter for any piece of failed equipments. A thorough practical knowledge of equipment. In this study Weibull statistics was used to mechanical, electrical as well as electronic parts able measure the Reliability of the system and also explain an operator to run a complex piece of equipment like the pouch machine smoothly.
3 Mostly operators gather the CDF governing the rate of failure. The fitness of the basic knowledge through experience in the field. the model developed using weibull distribution was But this has a side effect as well, till the time they had further verified using the KS test which is a distance become experts in their fields they had already wasted test . The value of the shape parameter helped to a considerable amount of valuable production time. understand the current state of the machine and justify Analysis of root causes through brainstormingand the use of the PM schedule developed. training sessions can only give a clear picture to the operators of equipments they are handling. This study was done on the pouch machine or the vertical filling Keywords: Downtime Losses, TPM, OEE, Pareto and sealing machine in a cosmetic plant. This machine Analysis , PM schedule,Weibull distribution, CDF, has a wide variety of applications from packing Distance test, K-S test.
4 Liquids, semi liquids to powder products as well. Table Ishows specifications of the machine under study. Abbreviations: TABLE I: MACHINE SPECIFICATIONS. TPM: Total Productive Maintenance. II. LITERATURE REVIEW Up to 66 strokes per min. Speed Depending upon product and Equipment Breakdown has always quantity to be packed. contributed towards machine downtime. Industrial Max roll width 800 mm Engineers have always tried to reduce downtime and Max roll diameter 600 mm increase the availability of machineries. TPM plays a Max pouch length 135mm vital role in achieving it. Wakjira, MelesseWorkneh. No. Of tracks 8. et al. (2012) has been able to reduce downtime and Main 3 hp, 3 phase 440 V, increase the OEE of existing machineries by TPM motor induction motor implementation in boiler plant in an Ethiopian malt Power consumption 10 KW. manufacturing unit. Through TPM, Gupta, Amit Machine dimensions m* m * m Kumar. et al. (2012) has been instrumental in Air required 12 cfm at 12 kg per cm Net weight 2000 kg increasing the availability of existing machinery hence Gross weight 2400 kg reducing the need for further capital investment.
5 The maintenance, Breakdown maintenance, Corrective forth pillar of TPM,Planned maintenance addresses maintenance and lastly Maintenance prevention are the problem of equipment Breakdown . Preventive ISSN: 2231-5381 Page 150. International Journal of Engineering Trends and Technology (IJETT) Volume 28 Number 3 - October 2015. the techniques involved in Planned maintenance. parameter) were estimated from the graph itself. The Preventive maintenance checklists as prepared by M, values of the distribution function were compared with Manoj., et al (2014) helped increase availability, the original cumulative failure rate to verify the MTBF and reduce MTTR significantly. Also the correctness of the model using the Kolmogorov- number of machine breakdowns were reduced after Smirnovcriteria. implementation in this case. Parameters like Reliability , MTTR and MTBF are also important To measure the Reliability of the machine factors that define Equipment Breakdown and help to using the weibull parameters and o, the formula understand equipments better.
6 To measure the R(t) = exp[-(t/ o) ]was used. The time period taken Reliability of any equipment, it is of utmost importance was the average loading time for a period of six to find out the cumulative distribution function (CDF) months. governing the failure rate. Mirzai, M. et al. (2006). V. Analysis & DISCUSSION. uses weibull distribution to explain the failure rate of power transformers in an Iranian electric company. A. Downtime Analysis . This paper further does a goodness of fit test on the developed mathematical model by using the KS test. There are a total of fifteen major downtime Bose, D., et al (2013) evaluates Reliability , availability losses which are recorded by the production and maintainability of a diesel locomotive engine and department. In order to narrow down the study only uses weibull statistics to explain the failure to the important ones, the individual loss percentage , Hsaio-Mei., (2009) states that for distance and cumulative loss percentage were calculated.
7 Tests in cumulative distribution function (CDF) the KS Downtime data is provided in details in Table II. test is a good approach. He further makes a TABLE II: MACHINE DOWNTIME DATA. comparison between the Chi-square test and the KS. test. Total Cumal Individu Cumulati III. OBJECTIVE Downtim loss ative al loss ve loss e losses (mins. loss percenta percentag The objectives of this work are to study the ) (mins.) ge e root causes behind equipment Breakdown . Secondly, Equipmen 1675 1675 34 34. to develop a PM schedule based on the findings of the t failure RCA Analysis . Thirdly, to find out the cumulative Minor 1460 3135 30 64. distribution function governing the rate of failure and stoppages lastly to measure the Reliability of the machine based Shift 297 3432 6 70. on the model parameters. change Change 285 3717 6 76. over IV. METHODOLOGY Utility 280 3997 6 81. failure At first, a Pareto Analysis of machine Others 921 4918 19 100. downtime losses showed that equipment Breakdown was the greatest contributor.
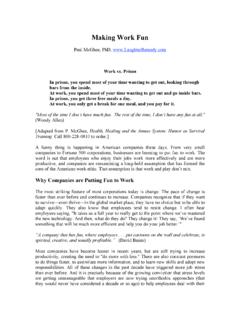
8 To understand Equipment Breakdown better, a RCA using the Why-Why Pareto Analysis of downtime losses in Fig. 1. technique was done with the help of machine gives a better picture of the situation. The various operators and maintenance personnel. This was types of downtime losses are plotted along the primary followed by the development of a PM schedule based horizontal axis. The individual loss in minutes is on common industrial practices. plotted along the primary vertical axis, while the cumulative loss percentage is plotted against the As for determining the cumulative secondary vertical axis. distribution function governing the failure rate the weibull distribution was adopted as a model. The loading time was expressed in terms of minutes and arranged in an ascending order. In order to convert the weibull equation into a linear one log normal function was used twice and after plotting these points the weibull parameters (shape parameter) and o(slope ISSN: 2231-5381 Page 151.)
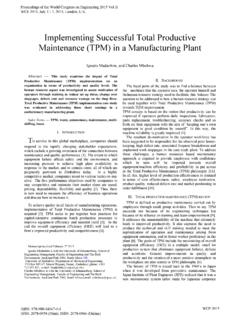
9 International Journal of Engineering Trends and Technology (IJETT) Volume 28 Number 3 - October 2015. 14000 100. 100. 2000 100100 12000. 10000 73 77 81 80. 1500 76 81 80 8000 62 68 60. 64 70 52. 60 6000 42 40. 1000 4000 25. 40 2000 20. 34. 500 20 0 0. 0 0. Types of downtime losses Types of equipment Breakdown : Pareto Analysis of Machine Downtime. Fig. 2: Pareto Analysis of Equipment Breakdown From the Pareto Analysis the factors Thus, from the Downtime Analysis , the major contributing roughly eighty percent towards downtime equipment Breakdown causes were found to be were found to beEquipment Breakdown , Minor Vacuum pump failure , Photocell sensor failure, heater stoppages, Shift change, Change Over, Utility failure, Cutting failure, paper setting problem, batch of these five major losses equipment cutting failure and the occurrence of leakage and Breakdown was further studied. Table III shows wrinkle(fold marks) on the pouches. Vacuum pump, equipment Breakdown in details.
10 Heater and photocell are essentially machine components while cutting failure, paper setting TABLE III: EQUIPMENT Breakdown DATA. problem, batch cutting failure, leakage and wrinkle are undesirable effects caused during machine operation. Equipment Total Cumulat Individu Cumul Breakdown loss ive loss al loss ative B. Root Cause Analysis . / failure (mins. (mins.) percenta loss statement ) ge percent Root Cause Analysis is a method to age understand the actual reasons behind any undesirable Vacuum 11695 11695 25 25. effect, so as to address the problem at the grass root pump Photocell 7460 19155 16 42. level. A typical example of RCA using the why-why sensor technique in case of vacuum pump is shown Fig. 3. Heater 4910 24065 11 52. Cutting 4660 28725 10 62. Paper 2720 31445 6 68. setting Batch 2195 33640 5 73. cutting Leakage 2010 35650 4 77. Wrinkle 1655 37305 4 81. Others 8845 46150 19 100. A second Pareto Analysis as in Fig. 2 was done so as to figure out the primary causes of equipment Breakdown .