Transcription of BUSINESS STATISTICS FINAL EXAM - Naval …
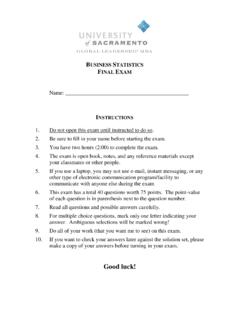
1 G lo b a l L ea d e r sh ip M B A BUSINESS STATISTICS FINAL EXAM Name: _____ INSTRUCTIONS 1. Do not open this exam until instructed to do so. 2. Be sure to fill in your name before starting the exam. 3. You have two hours (2:00) to complete the exam. 4. The exam is open book, notes, and any reference materials except your classmates or other people. 5. If you use a laptop, you may not use e-mail, instant messaging, or any other type of electronic communication program/facility to communicate with anyone else during the exam 6. This exam has a total 40 questions worth 75 points. The point-value of each question is in parenthesis next to the question number.
2 7. Read all questions and possible answers carefully. 8. For multiple choice questions, mark only one letter indicating your answer. Ambiguous selections will be marked wrong! 9. Do all of your work (that you want me to see) on this exam. 10. If you want to check your answers later against the solution set, please make a copy of your answers before turning in your exam. Good luck! BUSINESS STATISTICS FINAL Exam Solutions December 17, 2008 1 For questions 1-3, indicate the type of data described. 1. (1 pt) In a web-based survey, customers are asked to rate your company s product on the following scale: Excellent, good, average, poor.
3 (a) Continuous (b) Ordinal (c) Nominal (d) None of the above 2. (1 pt) In the same survey, customers are asked to provide their gender: male or female. (a) Continuous (b) Ordinal (c) Nominal (d) None of the above 3. (1 pt) As part of a quality improvement program, your mail order company records the length of time every customer spends on hold waiting to place their order via the telephone. (a) Continuous (b) Ordinal (c) Nominal (d) None of the above 4. (2 pts) Calculate the median of the following set of data: 123, 243, 322, 492, 537, 599, 620, 798, 812, 954. (a) 537 (b) 550 (c) 568 (d) 599 (e) None of the above are correct.
4 5. (2 pts) If you have a data set that consists of the following three values 1, 2, and 3, which of the following statements are true: (a) The range of the data is 3. (b) The sample standard deviation equals the sample average. (c) The sample standard deviation equals the sample variance. (d) Both (a) and (b) are true. (e) None of the above are true. 6. (1 pt) For CEO salaries throughout the entire United States (not just the data set we used in class), which has a distribution that is skewed to the right with some very large outliers, which is greater: the average salary or the median salary? (a) Average salary (b) Median salary (c) Cannot determine from the information given BUSINESS STATISTICS FINAL Exam Solutions December 17, 2008 2 7.
5 (1 pt) The inter-quartile range equals the 75th percentile minus the 25th percentile. (a) True (b) False For questions 8-10: You are the senior vice-president in charge of production for a company that manufactures two different types of widgets. You manage three divisions. You are interested in displaying various types of data about your company. Select the one technique from each list that is most applicable. 8. (2 pts) In order to summarize production for the past month, both broken down by the number of each type of widget produced by each division, as well as the total number of each type of widget produced and the total production for each division, you would use a: (a) Scatterplot (b) Contingency table (c) Confidence interval (d) Side-by-side boxplot (e) Histogram 9.
6 (2 pts) You also want to graphically assess whether there is a positive association between total daily production level (measured in terms of the dollar value of good widgets produced) and daily cost of scrap and re-work (measured in the cost in dollars of lost materials and labor to correct errors) across the divisions for the past 90 days. The best way to evaluate this is to use a: (a) Scatterplot (b) Contingency table (c) Confidence interval (d) Side-by-side boxplot (e) Histogram 10. (2 pts) You now want to graphically compare the distribution of salaries for mid-level managers between your three manufacturing divisions.
7 Each division has between 37 and 80 mid-level managers. The best way to display the information for this purpose is with a: (a) Scatterplot (b) Contingency table (c) Confidence interval (d) Side-by-side boxplot (e) Histogram 11. (1 pt) A number is drawn at random from a box. There is a 20% chance for it to be less than 10. There is a 10% chance for it to be more than 50. So, the chance of getting a number between 10 and 50 (inclusive) is 70%. (a) True (b) False BUSINESS STATISTICS FINAL Exam Solutions December 17, 2008 3 12. (1 pt) The Central Limit Theorem says that for large sample sizes the sample mean has an approximately normal distribution.
8 (a) True (b) False 13. (1 pt) From the empirical rule we can deduce that, for any distribution, 95% of the observations fall between the mean plus or minus two standard deviations. (a) True (b) False 14. (1 pt) As the number of degrees of freedom increase, the t distribution gets closer and closer to the normal distribution. (a) True (b) False 15. (2 pts) As the district sales manager for a franchise fast-food company, you prefer to compare sales performance in terms of standardized values. Having just hired a new analyst, you demonstrate for her how to standardize the value x = 20 given = 10 and = 5.
9 Show your work. Solution: Z = (x - ) / = (20 10) / 5 = 2 16. (2 pts) You are now looking at a computer printout of the daily sales for 100 franchise stores in your sales district prepared by the new analyst. The daily sales values have been standardized by subtracting the average daily sales for all 100 stores and dividing by the standard deviation of the daily sales for the 100 stores. The first 10 entries are: Does the printout look reasonable or is something wrong? (a) The numbers look reasonable. (b) Something is wrong. (c) Need more information about the computer program.
10 17. (3 pts) Assuming the standardized values (call them X) have a standard normal distribution, using either the tables in the back of your textbook or Excel, find the following probabilities (to four decimal places): (a) Pr(X < ) = (b) Pr(X < ) = (c) Pr(X < ) = BUSINESS STATISTICS FINAL Exam Solutions December 17, 2008 4 18. (2 pts) Based on your BUSINESS STATISTICS class in the Global MBA program, you know that a confidence interval is wider if: (a) A larger sample (n) is used. (b) A larger t or z value is used. (c) It is changed from a 95% CI to a 90% CI. (d) Both (b) and (c). (e) All of the above.
