Transcription of Centroid Based Clustering Algorithms- A Clarion Study
1 Centroid Based Clustering Algorithms- A Clarion Study Santosh Kumar Uppada PYDHA College of Engineering, JNTU-Kakinada Visakhapatnam, India Abstract The main motto of data mining techniques is to generate user-centric reports basing on the business requirements. The advent increase in thirst for knowledge discovery has increased the need of robust algorithms in the process of knowledge discovery. Mining in general is termed as intrinsic methodology of discovering interesting, formerly unknown data patterns. Clustering can be termed as a set-grouping task where similar objects are being grouped together. Clustering , a primitive anthropological method is the vital method in exploratory data mining for statistical data analysis, machine learning, and image analysis and in many other predominant branches of supervised and unsupervised learning.
2 Cluster algorithms can be categorized Based on the cluster models available depending on type of data we try to analyse. This paper focuses on different Centroid Based algorithms on par numerical and categorical data. Keywords Categorical data, k-means, k-medoids, CLARA, CLARANS, Euclidian, Manhattan, Minkowski, fuzzy, mushroom data, harmonic mean. I. INTRODUCTION Clustering has a very prominent role in the process of report generation [1]. It is treated as a vital methodology in discovery of data distribution and underlying patterns. Underlying aspect of any Clustering algorithm is to determine both dense and sparse regions of data regions.
3 The main emphasis is on the type of data taken and the efficiency at which we can cluster algorithms with high accuracy and low I/O costs which generally hinges on the similarity or distance metrics. Clustering algorithms in general is a blended of basic hierarchical and partitioning Based cluster formations [3]. In general cluster algorithms diversify from each other on par of abilities in handling different types of attributes, numerical and categorical data, and accuracy percentage and in handling of disk-non-migratory data [4]. Clustering algorithms in addition to aspect of handling numerical data, are forced to use combination of text and numerical data termed as categorical data [2].
4 Example of such need is the MUSHROOM data of popular UCI machine-learning repositories. For such data, it is very hectic to determine order or to quantify the dissimilarity factor as data here each tuple is a set of grilled mushrooms which is maintained using many categorical attributes. Classification which is termed as a sophisticated mechanism of generalizing known structure to apply to upcoming data, can be treated as backbone for the kick-off of Clustering . The basic difference between pure classification and Clustering is that the classifications is a supervised learning process while the former is an unsupervised method of learning process.
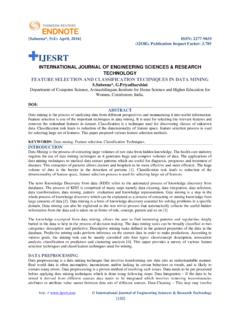
5 Figure 1. Cluster formation mechanism Centroid Based algorithm represents all of its objects on par of central vectors which need not be a part of the dataset taken. In any of the Centroid Based algorithms, main underlying theme is the aspect of calculating the distance measure [6] between the objects of the data set considered. The basic aspect of distance measure in general is derived using one of Euclidian, Minkowski or Manhattan distance measuring mechanism [5]. In general, mean is used in Euclidian distance measure, median in Manhattan and steepest descend method for calculating the distance measures [7]. Distance measure methodologies: a. Euclidian distance measure: Euclidian distance becomes a metric space, being processed using Pythagorean formula.
6 The position in a Euclidian n-space is termed as Euclidian vector. The Euclidian measure is generally given by ( , =( , = (qi- pi)2 In general Euclidian distance is being used in nonlinear dimensionality measure. In general correlation analysis is been calculated using this metric. The main drawback of this measure is that it is sensitive to high noise and sensitive in determining correlation between similar trends [8]. b. Manhattan distance measure Manhattan distance measure is a typical method that could be adapted even if a grid-like path is being traced in Santosh Kumar Uppada / (IJCSIT) International Journal of Computer Science and Information Technologies, Vol.))
7 5 (6) , 2014, data sets [9]. It is typically the distance measure between corresponding correlated objects. The measure in general is given by = | xi- yi| In general Manhattan distance is a heuristic Based algorithm which could determine distance metric for unevenly distributed objects. The major degrading aspect is that it is still sensitive in measuring correlation dissimilarity between similar trends. c. Minkowski distance measure In general Minkowski measure on Euclidian space is regarded as a generalization of both Euclidian and Manhattan distance measures. It can be treated as a power mean multiple of distance between objects. The Minkowski measure between two objects with order p is given by d = ( | xi - yi|p) 1/p In typical cases, Minkowski distance measure suffers with limiting factor value being reached to infinity [10].
8 In such cases a new measure termed as Chebyshev measure is being calculated. Here the following section examines some of the most predominant methods of Centroid Based algorithms. Section II deals about the primitive k-means algorithm , III defines the aspects of k-medoids, IV deals with the need of using CLARA algorithm and V defines a newer approach of CLARA termed using randomized search techniques termed as CLARANS, VI provides the aspects of dealing with K-Harmonic means, VII regarding the aspect of using fuzzy c-means algorithms. VIII summarizes all the Clustering algorithms we have taken with tabulation of different aspects that are to be considered.
9 II. K-MEANS The k-means algorithm deals with the process of defining clusters on par of centre of gravity of the cluster. It is a primitive algorithm for vector quantization originated from signal processing aspects. K-means algorithm is very widely used in pattern recognition, classifications of documents and image processing etc. This approach starts with assigning some objects as pivot objects. The value of k which determines the number of clusters that one wish to have is given before-hand. Now the Centroid of each such points are been calculated. Each data points are then assigned to a cluster whose Centroid is the nearest possible. Arithmetic mean is being calculated separately on par of its dimensionality [11].
10 K-means algorithm can be treated as two-phase approach where in the first phase; k centroids are being identified depending on the k value that has been chosen in general the distance measure is being calculated using Euclidian distance metric. The second phase involves in determining the new centroids for which the dissimilarity measures are very less. The process loops in finding new centroids until the property of convergence is met [12]. algorithm : Input: X = {x1, }, where n being a set of objects K; Number of desired clusters Output: A set of k clusters. Steps: 1. Randomly choose k objects from X as primary centroids . 2. Repeat Assign each data item di to the cluster which has the closest Centroid ; Calculate the new mean of each cluster; Until convergence criterion is met.