Transcription of CFA Level 1 Financial Ratios Sheet - AnalystPrep
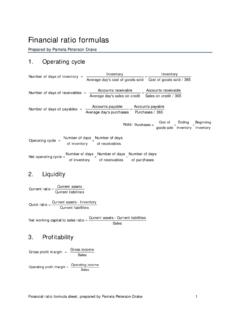
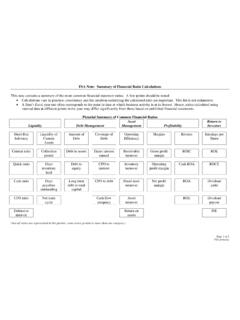
1 Ratios measure the company s ability to meet its short-term obligations and how quickly assets are converted into cash. The following table explains how to calculate the major liquidity RatiosProfitability Ratios measure the company s ability to generate profits from its resources (assets). The table below shows the calculations of these RatiosSolvency Ratios measure a company s ability to meet long-term obligations. Subsets of these Ratios are also known as leverage and long-term debt RatiosValuation Ratios measure the quantity of an asset or flow ( , earnings) associated with ownership of a specified claim ( , a share or ownership of the enterprise). The following tables show the most of the common valuation RatiosInventory turnoverDays of inventory on hands (DOH)Receivables turnoverRevenue or Revenue f rom credit salesAverage receivablesNumber of daysReceivable turnoverPurchasesAverage payablesNumber of days in a periodPayable turnoverRevenueAverage working capitalRevenueAverage fixed assetsRevenueAverage total assetsDays of sales outstanding (DSO)Payable TurnoverNumber of days of payablesWorking capital turnoverFixed assets turnoverTotal assets turnoverActivity RatiosRatio calculationActivity Ratios measure how efficiently a company performs day-to-day tasks, such as the collection of receivables and management of inventory.
2 The table below clarifies how to calculate most of the activity RatiosTotal debtTotal shareholders equityAverage total assetsTotal shareholders equityDebt-to-assetsDept-to-capitalDept- to-equityFinancial leverageSolvency ratiosRatio calculationEBT (Earnings Before Taxes)RevenueNet incomeRevenueGross profit marginOperating marginPretax marginNet profit marginReturn on sales ratiosRatio calculationEBITDebt + EquityNet incomeAverage total equityNet income - Preferred dividendsAverage common equityOpearting ROAROAR eturn on total capitalROER eturn on common equityReturn on investment ratiosRatio calculationInterest coverageFixed charge coverageCoverage RatiosRatio calculationCash + Short term marketable securitiesCurrent liabilitiesCash + Short term marketable securities + ReceivablesDaily expendituresDOH + DSO - Number of days of payablesCurrentQuickCashDefensive intervalCash conversion cycleLiquidity ratiosRatio calculationPage 1 CFA Level 1 Financial Ratios SheetCost of goods soldAverage inventoryNumber of days in periodInventory turnoverCurrent assetsCurrent liabilitiesCash + Short term marketable
3 Securities + ReceivablesCurrent liabilitiesTotal debtTotal assetsTotal debtTotal debt + Total shareholders equityGross profitRevenueOperating profitRevenueOperating incomeAverage total assetsNet incomeAverage total assetsEBITI nterest payementsEBIT + Lease payementsInterest payements + Lease Ratios measure a company s ability to meet long-term obligations. Subsets of these Ratios are also known as leverage and long-term debt RatiosSegment Ratios are important for segment reporting. Remember that a company doesn t have to disclose information about all of its segments; they only need to be disclosed if that segment constitutes 10 percent or more of the combined operating segments' revenue, assets, or the revenue of the reported segments is less than 75% of the revenue of the entire company, more segments must be reported until the 75% Level is RatiosLeverage Ratios measure the extent to which a company uses liabilities rather than equity to finance its assetsLeverage RatiosPrice per shareSales per sharePrice per shareBook value per shareP/EPC/FP/SP/BVValuation ratiosRatio calculationTotal debtTotal equityAverage total assetsAverage equityDebt-to-assets ratioDebt is defined as the sum of interest-bearing short-term and long-term debt.
4 |AAAADebt-to-capital ratioDebt-to-equity ratioFinancial leverage ratioLeverage RatiosSegment marginSegment turnoverSegment ROAS egmentt debt ratioSegment ratioSegment profit(loss)Segment revenueSegment profit(loss)Segment liabilitiesNumeratorSegment revenueSegment assetsSegment assetsSegment assetsDenominatorMeasures a segment sprofitability relartive to itsrevenuesMeasures a segment sability to generate revenueusing assetsMeasures a segment soperating profitabilityrelative its assetsMeasures a segmentsolvencyIndicationCFO - Capital expenditures - Dividend paidTotal debtFFO - DividendsCapital expendituresFFO (Funds f rom operations) to debtFree operating cash flow-to-debtDiscretionary cash flow-to-debtNet cash flow-to-capital expendituresb x ROED ividend payout ratioRetention rate (b)Sustainable growth rateDividend - related Ratios Ratio calculationCFO - Preferred dividendsWeighted average number of ordinary shares outstandingEBITDAA verage number of common stockDividends paidNumber of shares outstandingBasic EPSD iluted EPSCash flow per shareEBITDA per shareDividends per sharePrice per shareRatio calculationEBIT interest coveragePrice per shareRatio calculationEBITDA interest coverageFFO (funds f rom operations)interest coveragePrice per shareRatio calculationReturn on capitalPage 2 CFA Level 1 Financial Ratios SheetPrice per shareEarnings per sharePrice per shareCash flow per shareTotal debtTotal assetsTotal debtTotal debt + Total equityFFOT otal debtCFO (adjusted)
5 - Capital expendituresTotal debtCommon share dividendsNet income attributable to common sharesNet income attributable to common shares- Common share dividendsNet income attributable to common sharesNet income - Preferred dividendsWeighted average number of ordinary shares outstandingNet income - Preferred dividends+ Aftertax interest on ordinary shares outstandingWeighted average number of ordinary shares outstanding+ Number of common shares that wouldhave been issued at conversionEBIT Gross interest (prior to deductions for capitalizedinterest or interest income)EBITDA Gross interest (prior to deductions for capitalizedinterest or interest income)FFO + Interest paid - Operatinf lease adjustmentsGross interest (prior to deductions for capitalizedinterest or interest income)EBIT Average capitalwhere Capital = Equity + Non-current deffered taxes + Ratios are based on CFO.
6 CFO is operating cash flow under US GAAP or under IFRS, conditional to the fact that the company includes interest paid in operating activities. Performance RatiosCash flow to revenueCash return on assetsCash return on equityCash to incomeLeverage RatiosCalculationIndicationCash flow per shareDebt paymentDividend paymentInvesting and FinancingDebt CoverageInterest CoverageReinvestmentOperating cash generated perdollar of revenueOperating cash generated perdollar of asset investmentOperating cash generated perdollar of owner investmentCash generated f rom operationsOperating cash flow on a pershare basisAbility to pay debts withoperating cash flowsAbility to pay dividends withoperating cash flowsAbility to acquire assets, pay debts, and make distributionsto ownersFinancial risk and financialleverageAbility to meet interestobligationsAbility to acquire assets withoperating cash flowsPage 3 CFA Level 1 Financial Ratios SheetCFONet revenueCFOA verage total assetsCFOA verage shareholders equityCFO - of common shares outstandingCFOCash paid for long term debt repaymentCFOD ividends paidCFOCash outflows for investing and financing activitiesCFOT otal debtCFO + Interest paid + Taxes paidInterest paidCFOCash paid for long term assetsCFOO perating incom


