Transcription of Chairman's FOMC Press Conference Projections Materials ...
1 For release at 2:00 , EST, December 19, 2018 Economic Projections of Federal Reserve Board members and Federal Reserve Bank presidents undertheir individual assessments of projected appropriate monetary policy, December 2018 Advance release of table 1 of the Summary of Economic Projections to be released with the FOMC minutesPercentVariableMedian1 Central tendency2 Range32018 2019 2020 2021 Longerrun2018201920202021 Longerrun2018201920202021 LongerrunChange in real projection projection projection
2 PCE projection : Projectedappropriate policy pathFederal funds projection : Projections of change in real gross domestic product (GDP) and Projections for both measures of inflation are percent changes from the fourth quarter of the previousyear to the fourth quarter of the year indicated. PCE inflation and core PCE inflation are the percentage rates of change in, respectively, the price index for personal consumptionexpenditures (PCE) and the price index for PCE excluding food and energy.
3 Projections for the unemployment rate are for the average civilian unemployment rate in the fourthquarter of the year indicated. Each participant s Projections are based on his or her assessment of appropriate monetary policy. Longer-run Projections represent each participant sassessment of the rate to which each variable would be expected to converge under appropriate monetary policy and in the absence of further shocks to the economy. The projectionsfor the federal funds rate are the value of the midpoint of the projected appropriate target range for the federal funds rate or the projected appropriate target level for the federal fundsrate at the end of the specified calendar year or over the longer run. The September Projections were made in conjunction with the meeting of the Federal Open Market Committeeon September 25 26, 2018.
4 One participant did not submit longer-run Projections for the change in real GDP, the unemployment rate, or the federal funds rate in conjunction withthe September 25 26, 2018, meeting, and one participant did not submit such Projections in conjunction with the December 18 19, 2018, For each period, the median is the middle projection when the Projections are arranged from lowest to highest. When the number of Projections is even, the median is theaverage of the two middle The central tendency excludes the three highest and three lowest Projections for each variable in each The range for a variable in a given year includes all participants Projections , from lowest to highest, for that variable in that Longer-run Projections for core PCE inflation are not release at 2:00 , EST, December 19, 2018 Figure 1.
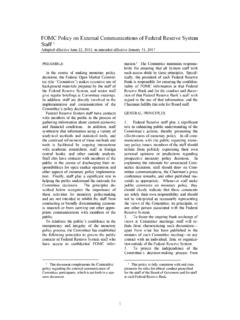
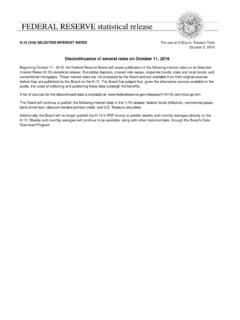
5 Medians, central tendencies, and ranges of economic Projections , 2018 21 and over the longer runChange in real GDPP ercent1232013201420152016201720182019202 02021 LongerrunMedian of projectionsCentral tendency of projectionsRange of projectionsActualUnemployment ratePercent34567201320142015201620172018 201920202021 LongerrunPCE inflationPercent123201320142015201620172 018201920202021 LongerrunNote:Definitions of variables and other explanations are in the notes to the Projections table. The data for theactual values of the variables are release at 2:00 , EST, December 19, 2018 Figure 2. FOMC participants assessments of appropriate monetary policy: Midpoint of target range or target level forthe federal funds runNote:Each shaded circle indicates the value (rounded to the nearest1/8percentage point) of an individual par-ticipant s judgment of the midpoint of the appropriate target range for the federal funds rate or the appropriate targetlevel for the federal funds rate at the end of the specified calendar year or over the longer run.
6 One participant did notsubmit longer-run Projections for the federal funds release at 2:00 , EST, December 19, 2018 Explanation of Economic Projections Charts The charts show actual values and Projections for three economic variables, based on FOMC participants individual assessments of appropriate monetary policy: Change in Real Gross Domestic Product (GDP) as measured from the fourth quarter of the previous year to the fourth quarter of the year indicated. Unemployment Rate the average civilian unemployment rate in the fourth quarter of each year. PCE Inflation as measured by the change in the personal consumption expenditures (PCE) price index from the fourth quarter of the previous year to the fourth quarter of the year indicated. Information for these variables is shown for each year from 2013 to 2021, and for the longer run.
7 The solid blue line, labeled Actual, shows the historical values for each variable. The solid red lines depict the median projection in each period for each variable. The median value in each period is the middle projection when the Projections are arranged from lowest to highest. When the number of Projections is even, the median is the average of the two middle Projections . The range and central tendency for each variable in each projection period are depicted in box and whiskers format. The blue connected horizontal and vertical lines ( whiskers ) represent the range of the Projections of policymakers. The bottom of the range for each variable is the lowest of all of the Projections for that year or period. Likewise, the top of the range is the highest of all of the Projections for that year or period.
8 The light blue shaded boxes represent the central tendency, which is a narrower version of the range that excludes the three highest and three lowest Projections for each variable in each year or period. The longer-run Projections , which are shown on the far right side of the charts, are the rates of growth, unemployment, and inflation to which a policymaker expects the economy to converge over time maybe in five or six years in the absence of further shocks and under appropriate monetary policy. Because appropriate monetary policy, by definition, is aimed at achieving the Federal Reserve s dual mandate of maximum employment and price stability in the longer run, policymakers longer-run Projections for economic growth and unemployment may be interpreted, respectively, as estimates of the economy s normal or trend rate of growth and its normal unemployment rate over the longer run.
9 The longer-run projection shown for inflation is the rate of inflation judged to be most consistent with the Federal Reserve s dual mandate. For release at 2:00 , EST, December 19, 2018 Explanation of Policy Path Chart This chart is based on policymakers assessments of appropriate monetary policy, which, by definition, is the future path of policy that each participant deems most likely to foster outcomes for economic activity and inflation that best satisfy his or her interpretation of the Federal Reserve s dual objectives of maximum employment and stable prices. Each shaded circle indicates the value (rounded to the nearest percentage point) of an individual participant s judgment of the midpoint of the appropriate target range for the federal funds rate or the appropriate target level for the federal funds rate at the end of the specified calendar year or over the longer run.
10