Transcription of CHAPTER - 3
1 47 CHAPTER - 3 ESTIMATES OF fertility INDICATORS Since inception, SRS has been providing data for estimating various fertility measures. The fertility indicators considered in this CHAPTER are Crude Birth Rate, General fertility Rate, Age Specific/Marital fertility Rates, Total /Marital fertility Rates and Gross Reproduction Rate. Apart from this, the CHAPTER includes sex ratio at birth. To examine the changes in the levels of fertility during the last decade, the average values of these fertility indicators for the years 2014-16 are compared with that for 2004-06. The crude birth rate (CBR) at all India level had declined from in 1971 to in 1981, registering a fall of about 8 per cent. During 1991-2016, the decline has been about 31 percent, from to The rural-urban differential has also narrowed over these years. However, the CBR has continued to be higher in rural areas compared to urban areas in the last three decades.
2 The total fertility rate (TFR) has declined from to during 1971 to 1981 and from to during 1991 to 2016. The TFR in rural areas has declined from to from 1971 to 2016 whereas the corresponding decline in urban areas has been from to during the same period. In 2016, around percent of the deliveries were institutional which includes Government as well as private hospitals. The percentage of institutional deliveries in urban areas is as against about percent recorded in rural areas. The data on most of the fertility indicators has been presented by age, sex and residence for all India and bigger States/UTs. This CHAPTER also includes data on fertility by level of education, order of birth, birth interval and medical attention at birth. Apart from the fertility indicators at State and National levels, the SRS report 2016 also provides estimates of birth rates at sub-State, viz. NSS Natural Division Level.
3 NSS natural divisions have been formed taking into consideration the geography of the State and by grouping contiguous districts having similar topography, population density, cropping pattern and rainfall etc. The Table 11 of this report contains data on birth rate besides death and infant mortality rate for 71 Natural Divisions of 22 bigger States/UTs. 48 Statement 14 below provides the Crude Birth Rate (CBR) by residence for India and bigger States/UTs for the year 2016. The CBR at national level is varying from in rural in urban areas. Andhra Pradesh, Delhi, Himachal Pradesh, Jammu & Kashmir, Karnataka, Kerala, Maharashtra, Odisha, Punjab, Tamil Nadu, Telangana, Uttarakhand and West Bengal are the States having birth rate below 20 both in rural and urban areas. On the other hand, Bihar has the highest birth rate in rural areas ( ) and Uttar Pradesh has the highest birth rate in urban areas ( ) areas, followed by Uttar Pradesh ( ) and Rajasthan ( ) in rural and urban areas respectively.
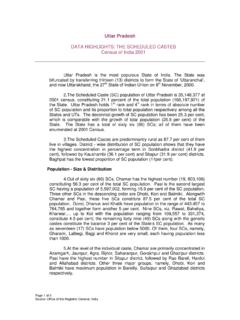
4 The lowest CBR was recorded in rural areas of Kerala ( ) and in urban areas of Himachal Pradesh ( ). Based on the figures in the Statement 14 given below, the graphical representation of birth rate of bigger States/UTs by residence is depicted in Chart 26. Chart 27 gives the distribution of bigger States/UTs by values of birth rate for rural and urban areas. Statement 14 CBR (Crude Birth Rate) by residence, India and bigger States/UTs, 2016 India and bigger States/UTs Total Rural Urban India Andhra Pradesh Assam Bihar Chhattisgarh Delhi Gujarat Haryana Himachal Pradesh Jammu & Kashmir Jharkhand Karnataka Kerala Madhya Pradesh Maharashtra Odisha Punjab Rajasthan Tamil Nadu Telangana Uttar Pradesh Uttarakhand West Bengal 49 50 Chart 27.
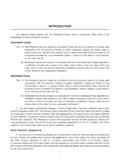
5 Distribution of bigger States/UTs by values of Birth Rate for rural and urban areas, 2016 51 Statement 15 below provides the percentage change in average crude birth rate between the periods 2004-06 and 2014-16 for India and bigger States/UTs separately for rural and urban areas. At the national level, the rate of decline in birth rate is percent. The rate of decline in average birth rate varies from percent in West Bengal to percent in Kerala. Such decline in rural areas is from percent in West Bengal to percent in Kerala. In Andhra Pradesh, Assam, Jharkhand, Kerala and Uttarakhand, the 3-year average crude birth rate in urban areas has increased in by percent, percent.
6 Percent, percent and percent respectively. The 3-year average crude birth rate of Kerala and Tamil Nadu is nearly same in rural and urban areas during 2014-16. Charts 28, 29 and 30 depict the average birth rate between 2004-06 and 2014-16 of India and bigger States/UTs for Total, Rural and Urban areas respectively. Chart 31 shows the percentage change in average birth rate between 2004-06 and 2014-16 by residence for India and bigger States/UTs. Statement 15 Percentage change in average Crude Birth Rate between 2004-06 and 2014-16 by residence, India and bigger States/UTs India and bigger States/UTs Total Rural Urban 2004-06 2014-16 % Change 2004-06 2014-16 % Change 2004-06 2014-16 % Change India Andhra Pradesh* Assam Bihar Chhattisgarh Delhi Gujarat Haryana Himachal Pradesh Jammu & Kashmir Jharkhand Karnataka Kerala Madhya Pradesh Maharashtra Odisha Punjab Rajasthan Tamil Nadu Uttar Pradesh Uttarakhand West Bengal * Andhra Pradesh includes Telangana.
7 52 53 54 55 56 The Statement 16 below presents sex ratio at birth during the period 2014-16.
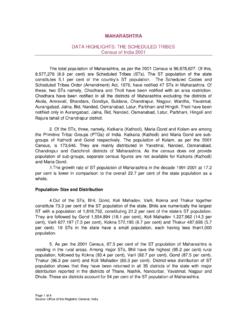
8 The sex ratio at birth for the country for the period 2014-16 (3-years average) has been estimated at 898. At National level, it is 902 in rural areas and 888 in urban areas. Among the bigger States/UTs, the sex ratio at birth varies from 963 in Chhattisgarh to 832 in Haryana. In the rural areas, the highest and the lowest sex ratio at birth are in the States of Chhattisgarh (995) and Haryana (835) respectively. The sex ratio in urban areas varies from 957 in Madhya Pradesh to 820 in Gujarat. Chart 32 depicts the variation in sex ratio by residence among bigger States/UTs in the country. Statement 16 Sex ratio (female per 1000 male) at birth by residence, India and bigger States/UTs, 2014-2016 India and bigger States/UTs Total Rural Urban India 898 902 888 Andhra Pradesh 913 923 888 Assam 896 898 880 Bihar 908 912 871 Chhattisgarh 963 995 833 Delhi 857 917 856 Gujarat 848 867 820 Haryana 832 835 824 Himachal Pradesh 917 921 852 Jammu & Kashmir 906 903 919 Jharkhand 918 927 882 Karnataka 935 965 883 Kerala 959 972 946 Madhya Pradesh 922 913 957 Maharashtra 876 872 882 Odisha 948 959 871 Punjab 893 876 921 Rajasthan 857 862 838 Tamil Nadu 915 926 903 Telangana 901 940 841 Uttar Pradesh 882 871 923 Uttarakhand 850 857 832 West Bengal 937 938 932 57 58
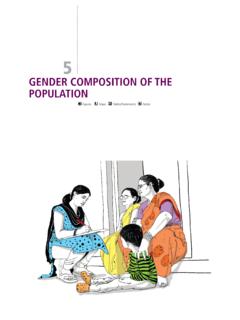
9 Estimates of General fertility Rate (GFR), a refined measure of fertility , being defined as the number of live births per thousand women in the reproductive age group 15-49 years, is a useful tool for measuring fertility . The GFR for all-India and bigger States/UTs are given below in Statement 17 separately for rural and urban areas. At the national level, children were born to every thousand women aged 15-49 years. This number varies from in urban areas to in rural areas. Among the bigger States/UTs, GFR varies from in Kerala to in Bihar. Chart 33 gives a pictorial comparison of bigger States/UTs by level of GFR. It can be seen that GFR in rural areas of Kerala is just higher than urban areas with a difference of Chart 34 gives the distribution of bigger States/UTs by values of GFR for rural and urban areas. Statement 17 GFR (General fertility Rate) by residence, India and bigger States/UTs, 2016 India and bigger States/UTs Total Rural Urban India Andhra Pradesh Assam Bihar Chhattisgarh Delhi Gujarat Haryana Himachal Pradesh Jammu & Kashmir Jharkhand Karnataka Kerala Madhya Pradesh Maharashtra Odisha Punjab Rajasthan Tamil Nadu Telangana Uttar Pradesh Uttarakhand West Bengal 59 60 Chart 34.
10 Distribution of bigger States/UTs by values of General fertility Rate(GFR) for rural and urban areas, 2016 61 Changes in the average level of General fertility Rate (GFR) between 2004-06 and 2014-16 for India and bigger States/UTs are shown below in Statement 18. At the all India level, a decline of percent in GFR has been registered during the decade and it varies from percent in rural to percent in urban areas. Among the bigger States/UTs, the percentage decline in GFR varies from in Uttar Pradesh to in Kerala. Charts 35, 36 and 37 depict the average GFR between 2004-06 and 2014-16 of India and bigger States/UTs for Total, Rural and Urban areas respectively.