Transcription of Chapter 5: Errors in Chemical Analyses
1 Chapter 5: Errors in Chemical Analyses Source: of Analytical Chemistry, Holler, Measurements invariably involve Errors and uncertainties. it is impossible to perform a Chemical analysis that is totally free of Errors or uncertainties We can only hope to minimize Errors and estimate their size with acceptable accuracy Errors are caused by faulty calibrations or standardizations or by random variations and uncertainties in results. Frequent calibrations, standardizations, and Analyses of known samples can sometimes be used to lessen all but the random Errors and uncertainties. The term error has two slightly different meanings.
2 1)error refers to the difference between a measured value and the true or known value. 2)error often denotes the estimated uncertainty in a measurement or experiment. We can only hope to minimize Errors and estimate their size with acceptable accuracy Every measurement is influenced by many uncertainties, which combine to produce a scatter of results. Because measurement uncertainties can never be completely eliminated, measurement data can only give us an estimate of the true value. However, the probable magnitude of the error in a measurement can often be evaluated. It is then possible to define limits within which the true value of a measured quantity lies with a given level of probability.
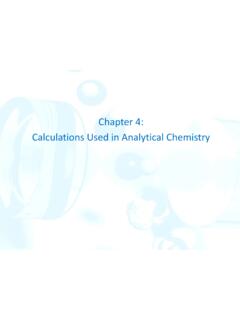
3 Before beginning an analysis ask, What maximum error can be tolerated in the result? The answer to this question often determines the method chosen and the time required to complete the analysis. Figure 5-1 Results from six replicate determinations of iron in aqueous samples of a standard solution containing ppm iron(III). Note that the results range from a low of ppm to a high of ppm of iron. The average, or mean value, x , of the data is ppm, which rounds to ppm 5A Some important terms To improve the reliability and to obtain information about the variability of results, two to five portions (replicates) of a sample are usually carried through an entire analytical procedure.
4 Replicates are samples of about the same size that are carried through an analysis in exactly the same way. Individual results from a set of measurements are seldom the same Usually, the best estimate is considered to be the central value for the set. The central value of a set should be more reliable than any of the individual results. Usually, the mean or the median is used as the central value for a set of replicate measurements. An analysis of the variation in the data allows us to estimate the uncertainty associated with the central value. The Mean and the Median The mean, also called the arithmetic mean or the average, is obtained by dividing the sum of replicate measurements by the number of measurements in the set: The symbol xi means to add all of the values xi for the replicates; xi represents the individual values of x making up the set of N replicate measurements.
5 The median is the middle value in a set of data that has been arranged in numerical order. The median is used advantageously when a set of data contain an outlier. An outlier is a result that differs significantly from others in the set. An outlier can have a significant effect on the mean of the set but has no effect on the median. NxxNii 1 Precision * Precision describes the agreement among several results obtained in the same way. Describes the reproducibility of measurements. * Precision is readily determined by simply repeating the measurement on replicate samples. * Precision of a set of replicate data may be expressed as standard deviation, variance, and coefficient of variation.
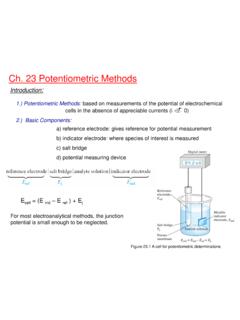
6 * di, deviation from mean, is how much xi, the individual result, deviates from the mean. xxdii Accuracy Accuracy indicates the closeness of the measurement to the true or accepted value and is expressed by the error. Accuracy measures agreement between a result and the accepted value. Accuracy is often more difficult to determine because the true value is usually unknown. An accepted value must be used instead. Accuracy is expressed in terms of either absolute or relative error. Figure 5-2 Note that we can have very precise results (upper right) with a mean that is not accurate and an accurate mean (lower left) with data points that are imprecise.
7 Absolute Error * The absolute error of a measurement is the difference between the measured value and the true value. If the measurement result is low, the sign is negative; if the measurement result is high, the sign is positive. tixxE Relative Error The relative error of a measurement is the absolute error divided by the true value. Relative error may be expressed in percent, parts per thousand, or parts per million, depending on the magnitude of the result. %100 ttirxxxETypes of Errors in Experimental Data Results can be precise without being accurate and accurate without being precise.
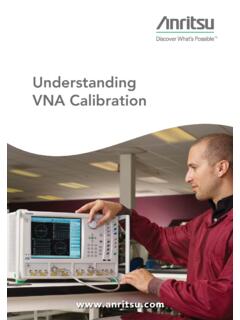
8 Each dot represents the error associated with a single determination. Each vertical line labeled (xi - xt) is the absolute average deviation of the set from the true value. Figure 5-3 Absolute error in the micro-Kjeldahl determination of nitrogen. (or determinate) error, causes the mean of a data set to differ from the accepted value. 2. Random (or indeterminate) error, causes data to be scattered more or less symmetrically around a mean value. A third type of error is gross error. These differ from indeterminate and determinate Errors . They usually occur only occasionally, are often large, and may cause a result to be either high or low.
9 They are often the product of human Errors . Gross Errors lead to outliers, results that appear to differ markedly from all other data in a set of replicate measurements. Chemical Analyses are affected by at least two types of Errors : 5B Systematic Errors Systematic Errors have a definite value, an assignable cause, and are of the same magnitude for replicate measurements made in the same way. They lead to bias in measurement results. There are three types of systematic Errors : Instrumental Errors . Method Errors Personal Errors Instrumental Errors are caused by nonideal instrument behavior, by faulty calibrations, or by use under inappropriate conditions Pipets, burets, and volumetric flasks may hold or deliver volumes slightly different from those indicated by their graduations.
10 Calibration eliminates most systematic Errors of this type. Electronic instruments can be influenced by noise, temperature, pH and are also subject to systematic Errors . Errors of these types usually are detectable and correctable. Method Errors The nonideal Chemical or physical behavior of the reagents and reactions on which an analysis is based often introduce systematic method Errors . Such sources of nonideality include the slowness of some reactions, the incompleteness of others, the instability of some species, the lack of specificity of most reagents, and the possible occurrence of side reactions that interfere with the measurement process.