Transcription of Chapter 6. Data-Flow Diagrams
1 1 Chapter 6. Data-Flow DiagramsTable of ContentsObjectives .. 1 Introduction to Data-Flow Diagrams .. 2 What are Data-Flow Diagrams ? .. 2An example Data-Flow diagram .. 2 The benefits of Data-Flow Diagrams .. 3 Case study .. 3 The different kinds (and levels) of Data-Flow Diagrams .. 3 Elements of Data-Flow Diagrams .. 4 Processes .. 4 data - flows .. 5 data stores .. 6 External entities .. 7 Multiple copies of entities and data stores on the same diagram .. 8 Context Diagrams .. 8 What is a context diagram? .. 8 Constructing a context diagram .. 9 Level 1 Data-Flow Diagrams .. 9 What is a level 1 DFD? .. 9 Constructing level 1 DFDs .. 10 Decomposing Diagrams into level 2 and lower hierarchical levels .. 10 What is a level 2 (or lower) DFD? .. 11 Constructing level 2 (and lower) DFDs functional decomposition.
2 11 Making levels .. 12 Balancing .. 13 Numbering .. 13 Process descriptions .. 13 Validation .. 14An example in constructing a Data-Flow diagram .. 14 Identify the system boundaries .. 15 Follow inputs .. 15 Follow events .. 16 Fill in gaps .. 17 Repeat .. 17 Review .. 18 Questions .. 18 Answers .. 21 ObjectivesAt the end of this Chapter you should be able to: Explain the purpose of Data-Flow Diagrams . Describe the meaning of the symbols used in Data-Flow Diagrams . Describe the generic framework activities at which data flow Diagrams can be used and thecorresponding roles of Data-Flow Diagrams in these stages. Construct simple Data-Flow Diagrams from a textual description. Construct a levelled set of Data-Flow Diagrams2 Understand how to check the consistency of related Data-Flow to Data-Flow diagramsWhat are Data-Flow Diagrams ?
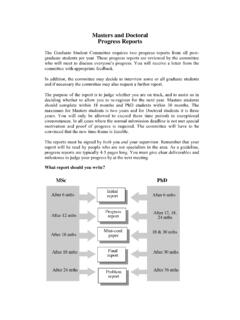
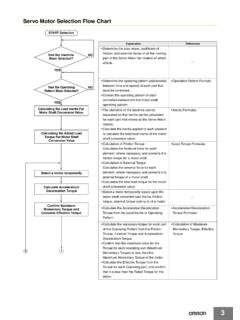
3 Data-Flow Diagrams (DFDs) model a perspective of the system that is most readily understood by users the flow of information through the system and the activities that process this Diagrams provide a graphical representation of the system that aims to be accessible tocomputer specialist and non-specialist users alike. The models enable software engineers, customersand users to work together effectively during the analysis and specification of requirements. Althoughthis means that our customers are required to understand the modeling techniques and constructs, indata-flow modeling only a limited set of constructs are used, and the rules applied are designed to besimple and easy to follow. These same rules and constructs apply to all Data-Flow Diagrams ( , foreach of the different software process activities in which DFDs can be used).An example Data-Flow diagramAn example of part of a Data-Flow diagram is given below. Do not worry about which parts of whatsystem this diagram is describing look at the diagram to get a feel for the symbols and notation ofa Data-Flow An example Data-Flow diagramAs can be seen, the DFD notation consists of only four main the activities carried out by the system which use and transform information.
4 Processesare notated as rectangles with three parts, such as Order Supplies and Make Payments in theabove the data inputs to and outputs from to these activities. data - flows are notated asnamed arrows, such as Delivery and Supply Order in the example entities the sources from which information flows into the system and the recipientsof information leaving the system. External entities are notated as ovals, such as Supplier in theexample stores where information is stored within the system. data stores are notated as rectangleswith two parts, such as Supplier Details and Orders in the example Diagrams are supplemented by supporting documentation including a data dictionary, describingthe contents of data - flows and data stores; and process definitions, which provide detaileddescriptions of the processes identified in the Data-Flow benefits of Data-Flow diagramsData-flow Diagrams provide a very important tool for software engineering, for a number of reasons: The system scope and boundaries are clearly indicated on the Diagrams (more will be describedabout the boundaries of systems and each DFD later in this Chapter ).
5 The technique of decomposition of high level Data-Flow Diagrams to a set of more detailed Diagrams ,provides an overall view of the complete system, as well as a more detailed breakdown anddescription of individual activities, where this is appropriate, for clarification and Diagrams also provide a partition of a software-system into those things which areinside the system and those things which are outside of the studyWe shall be using the following case study to explore different aspects of Data-Flow modeling LTD case studyVideo-Rental LTD is a small video rental store. The store lends videos to customers for afee, and purchases its videos from a local customer wishing to borrow a video provides the empty box of the video they desire, theirmembership card, and payment payment is always with the credit card used to open thecustomer account. The customer then returns the video to the store after watching a loaned video is overdue by a day the customer's credit card is charged, and a reminderletter is sent to them.
6 Each day after that a further card is made, and each week a reminderletter is sent. This continues until either the customer returns the video, or the charges areequal to the cost of replacing the customers fill out a form with their personal details and credit card details, and thecounter staff give the new customer a membership card. Each new customer's form is addedto the customer local video supplier sends a list of available titles to Video-Rental LTD, who decidewhether to send them an order and payment. If an order is sent then the supplier sends therequested videos to the store. For each new video a new stock form is completed and placedin the stock different kinds (and levels) of data -flowdiagramsAlthough all Data-Flow Diagrams are composed of the same types of symbols, and the validation rulesare the same for all DFDs, there are three main types of Data-Flow diagram: Data-Flow Diagrams4 Context Diagrams context diagram DFDs are Diagrams that present an overview of the systemand its interaction with the rest of the world.
7 Level 1 Data-Flow Diagrams Level 1 DFDs present a more detailed view of the system thancontext Diagrams , by showing the main sub-processes and stores of data that make up the systemas a whole. Level 2 (and lower) Data-Flow Diagrams a major advantage of the Data-Flow modellingtechnique is that, through a technique called levelling , the detailed complexity of real worldsystems can be managed and modeled in a hierarchy of abstractions. Certain elements of any Data-Flow diagram can be decomposed ( exploded ) into a more detailed model a level lower in this unit we shall investigate each of the three types of diagram in the sequence they aredescribed above. This is both a sequence of increasing complexity and sophistication, and also thesequence of DFDs that is usually followed when modeling each type of diagram we shall first investigate what the features of the diagram are, then we shallinvestigate how to create that type of diagram.
8 However, before looking at particular kinds of Data-Flow Diagrams , we shall briefly examine each of the symbols from which DFDs are of Data-Flow diagramsFour basic elements are used to construct Data-Flow Diagrams : processes data - flows data stores external entitiesThe rest of this section describes each of the four elements of DFDs, in terms of their purpose, howthe element is notated and the rules associated with how the element relates to others in a and softwareA number of different notations exist for depicting these elements, although it is only theshape of the symbols which vary in each case, not the underlying logic. This unit uses theSelect SSADM notation in the description and construction of Data-Flow Data-Flow Diagrams are not a part of the UML specification, ArgoUML and Umbrello donot support their creation. However, Dia is free software available for both Windows andUbuntu which does support Data-Flow are the essential activities, carried out within the system boundary, that use process is represented in the model only where the information which provides the input into theactivity is manipulated or transformed in some way, so that the data -flowing out of the process ischanged compared to that which flowed activity may involve capturing information about something that the organisation is interestedin, such as a customer or a customer's maintenance call.
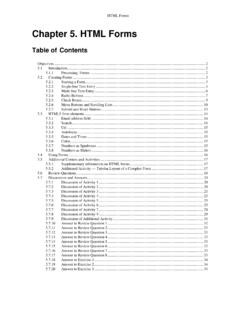
9 It may be concerned with recording changesto this information, a change in a customer's address for example. It may require calculations to becarried out, such as the quantity left in stock following the allocation of stock items to a customer'sData-Flow Diagrams5job; or it may involve validating information, such as checking that faulty equipment is covered bya maintenance are depicted with a box, divided into three The notation for a processThe top left-hand box contains the process number. This is simply for identification and referencepurposes, and does not in any way imply priority and main part of the box is used to describe the process itself, giving the processing performed onthe data it smaller rectangular box at the bottom of the process is used in the Current Physical data -FlowDiagram to indicate the location where the processing takes place. This may be the physical location the Customer Services Department or the Stock Room, for example.
10 However, it is more oftenused to denote the staff role responsible for performing the process. For example, Customer Services,Purchasing, Sales Support, and so rules for processes are: Process names should be an imperative verb specific to the activity in question, followed by a pithyand meaningful description of the object of the activity. Create Contract, or Schedule Jobs, asopposed to using very general or non-specific verbs, such as Update Customer Details or ProcessCustomer Call. Processes may not act as data sources or sinks. data flowing into a process must have somecorresponding output, which is directly related to it. Similarly, data -flowing out of a process musthave some corresponding input to which it is directly related. Normally only processes that transform system data are shown on Data-Flow Diagrams . Only wherean enquiry is central to the system is it included. Where a process is changing data from a data store, only the changed information flow to the datastore (and not the initial retrieval from the data store) is shown on the diagram.