Transcription of Chapter 6 The t-test and Basic Inference Principles
1 Chapter 6 The t-test and Basic InferencePrinciplesThe t-test is used as an example of the Basic Principles of statistical of the simplest situations for which we might design an experiment isthe case of a nominal two-level explanatory variable and a quantitative outcomevariable. Table shows several examples. For all of these experiments, the treat-ments have two levels, and the treatment variable is nominal. Note in the table thevarious experimental units to which the two levels of treatment are being appliedfor these If we randomlyassignthe treatments to these units this willbe a randomized experiment rather than an observational study, so we will be ableto apply the word causes rather than just is associated with to any statisti-cally significant result.
2 This Chapter only discusses so-called between subjects explanatory variables, which means that we are assuming that each experimentalunit is exposed to only one of the two levels of treatment (even though that is notnecessarily the most obvious way to run the fMRI experiment).This Chapter shows one way to perform statistical Inference for the two-group,quantitative outcome experiment, namely the independent samples t-test . Moreimportantly, the t-test is used as an example for demonstrating the Basic principlesof statistical Inference that will be used throughout the book. The understandingof these Principles , along with some degree of theoretical underpinning, is keyto using statistical results intelligently.
3 Among other things, you need to reallyunderstand what a p-value and a confidence interval tell us, and when they can141142 Chapter 6. T-TESTE xperimentalunitsExplanatory variableOutcome variablepeopleplacebo vs. vitamin Ctime until the first cold symp-tomshospitalscontrol handwashingnumber of infections in the nextsix monthspeoplemath tutor A vs. math tutor Bscore on the final exampeopleneutral stimulus vs. fear stim-ulusratio of fMRI activity in theamygdala to activity in the hip-pocampusTable : Some examples of experiments with a quantitative outcome and a nom-inal 2-level explanatory variableand cannot be alternative inferential procedure is one-way ANOVA, which always givesthe same results as the t-test , and is the topic of the next mentioned in the preface, it is hard to find a linear path for learning exper-imental design and analysis because so many of the important concepts are inter-dependent.
4 For this Chapter we will assume that the subjects chosen to participatein the experiment are representative, and that each subject is randomly assignedto exactly one treatment. The reasons we should do these things and the conse-quences of not doing them are postponed until the Threats Chapter . For now wewill focus on the EDA and confirmatory analyses for a two-group between-subjectsexperiment with a quantitative outcome. This will give you a general picture ofstatistical analysis of an experiment and a good foundation in the underlying the-ory. As usual, more advanced material, which will enhance your understandingbut is not required for a fairly good understanding of the concepts, is shaded CASE STUDY FROM THE FIELD OF HUMAN-COMPUTER INTERACTION (HCI) Case study from the field of Human-ComputerInteraction (HCI)This (fake) experiment is designed to determine which of two background colorsfor computer text is easier to read, as determined by the speed with which atask described by the text is performed.
5 The study randomly assigns 35 universitystudents to one of two versions of a computer program that presents text describingwhich of several icons the user should click on. The program measures how long ittakes until the correct icon is clicked. This measurement is called reaction time and is measured in milliseconds (ms). The program reports the average time for20 trials per subject. The two versions of the program differ in the backgroundcolor for the text (yellow or cyan).The data can be found in the file on this book s web data is tab delimited with no header line and with columns for subject identification,background color, and response time in milliseconds. The coding for the colorcolumn is 0=yellow, 1=cyan.
6 The data look like this:Subject IDColorTime (ms) that in SPSS if you enter the Values for the two colors and turn on Value labels , then the color words rather than the numbers will be seen in thesecond column. Because this data set is not too large, it is possible to examineit to see that 0 and 1 are the only two values for Color and that the time rangesfrom 291 to 1005 milliseconds (or to seconds). Even for a dataset thissmall, it is hard to get a good idea of the differences in response time across thetwo colors just by looking at the are some Basic univariate exploratory data analyses. There is no point indoing EDA for the subject IDs. For the categorical variable Color, the only usefulnon-graphical EDA is a tabulation of the two 6.
7 T-TESTF requenciesBackground Frequency column gives the Basic tabulation of the variable s subjects were shown a yellow background, and 18 were shown cyan fora total of 35 subjects. The Percent Valid vs. Percent columns in SPSS differonly if there are missing values. The Percent Valid column always adds to 100%across the categories given, while the Percent column will include a Missing category if there are missing data. The Cumulative Percent column accounts foreach categoryplusall categories on prior lines of the table; this is not very usefulfor nominal is non-graphical EDA. Other non-graphical exploratory analyses of Color,such as calculation of mean, variance, etc. don t make much sense because Coloris a categorical variable.
8 (It is possible to interpret the mean in this case becauseyellow is coded as 0 and cyan is coded as 1. The mean, , represents thefraction of cyan backgrounds.) For graphical EDA of the color variable you couldmake a pie or bar chart, but this really adds nothing to the simple vs the quantitative variable Reaction Time, the non-graphical EDA wouldinclude statistics like these:NMinimumMaximumMeanStd. DeviationReaction Time (ms) we can see that there are 35 reactions times that range from 291 to 1005milliseconds, with a mean of and a standard deviation of We cancalculate that the variance is 32454, but we need to look further at thedata to calculate the median or IQR. If we were to assume that the data follow aNormal distribution, then we could conclude that about 95% of the data fall withinmean plus or minus 2 sd, which is about 310 to 1030.
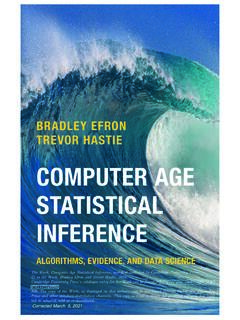
9 But such an assumption isis most likely incorrect, because if there is a difference in reaction times betweenthe two colors, we would expect that the distribution of reaction timesignoringcolorwould be some bimodal distribution that is a mixture of the two CASE STUDY FROM THE FIELD OF HUMAN-COMPUTER INTERACTION (HCI)145reaction time distributions for the two histogram and/or boxplot of reaction time will further help you get a feel forthe data and possibly find bivariate EDA, we want graphs and descriptive statistics for the quantita-tive outcome (dependent) variable Reaction Time broken down by the levels of thecategorical explanatory variable (factor) Background Color. A convenient way todo this in SPSS is with the Explore menu option.
10 Abbreviated results are shownin this table and the graphical EDA (side-by-side boxplots) is shown in figure ConfidenceLower for Mean Upper ConfidenceLower for Mean Upper briefly, the mean reaction times for the subjects shown cyan backgroundsis about 19 ms shorter than the mean for those shown yellow backgrounds. Thestandard deviation of the reaction times is somewhat larger for the cyan groupthan it is for the yellow 6. T-TESTF igure : Boxplots of reaction time by HOW CLASSICAL statistical Inference WORKS147 EDA for the two-group quantitative outcome experiment should in-clude examination of sample statistics for mean, standard deviation,skewness, and kurtosis separately for each group, as well as boxplotsand should follow up on this EDA with formal statistical testing.