Transcription of Chapter 8 Phase Diagrams - Physics and Astronomy
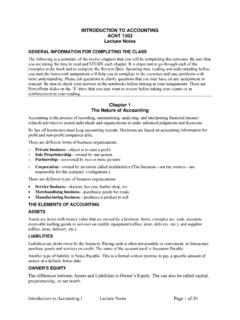
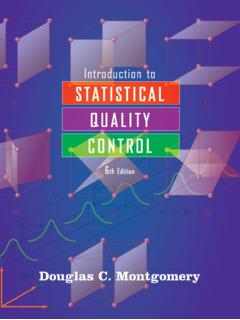
1 1 Chapter 8 Chapter 8 Phase DiagramsChapter 8 in Smith & HashemiAdditional resources: Callister, Chapter 9 and 10A phasein a material is a region that differ in its microstructure andor composition from another region homogeneous in crystal structure and atomic arrangement have same chemical andphysical properties throughout have a definite interfaceand able to be mechanically separated from its surroundingsAl2 CuMgAlH2O(solid, ice) in H2O (liquid) 2 phases2 Chapter 8 Phase diagram and degrees of freedom A Phase diagramsis a type of graph used to show the equilibriumconditions between the thermodynamically-distinct phases ; or to show what phases are present in the material system at various T, p, andcompositions equilibrium is important: Phase Diagrams are determined by using slow cooling conditions no information about kineticsDegree of freedom (or variance) F is the numberof variables (T, p, and composition) that can be changed independently without changing the phases of the systemPhase diagram of CO23 Chapter Phase Diagram of Water Field 1 Phase Line Phase coexistence, 2 phases Triple point 3 phases3 phases : solid, liquid, vapourTriple point: Torr(~603Pa), Gibbs Phase RuleF + P = C + 2F is # of degrees of freedom or varianceP is # of phasesC is # of componentsH2OC=1(i) P=1, F=2; (ii) P=2, F=1.
2 (iii) P=3, F=0 Gibbs' Phase rule describes the possible # of degrees of freedom (F)in a closed systemat equilibrium, in terms of the number of separate phases (P)and the number of chemical components (C)in the system (derived from thermodynamic principles by Josiah W. Gibbs in the 1870s)Componentis the minimum # of species necessary to define the composition of the system5 Chapter How to construct Phase Diagrams ? -Cooling curvesCooling curves: used to determine Phase transition temperature record T of material vs time, as it cools from its molten state through solidification and finally to RT (at a constant pressure!!!)The cooling curve of a pure metalBC:plateaueor region of thermal arrest; in this region material is in the form of solid and liquid phases CD: solidification is completed, T drops6 Chapter 8 Cooling curve for pure iron @ 1atmAs T : melted iron (liquid) bccFe, (solid) fccFe, (solid) bccFe, (RT)7 Chapter Binary systems (C = 2)F + P = C + 2 = 4 F = 4 - P1.
3 Two components are completely mixablein liquid and solid Phase (form a solid state solution), and don t react chemically2. Two components (A and B) can form stable compoundsor alloys (for example: A, A2B, A3B, B)Degrees of freedom (F): p, T, compositionpTcompositionAt p = const (or T=const)T0 weight % of B 100%100% A100% BF = 3 - P8 Chapter 8 Binary Isomorphous Alloy System (C=2)Isomorphous: Two elements are completely soluble in each other in solid and liquid state; substitutional solid state solution can be formed; single type of crystal str. existReminder: Hume-Rothery rules: (1) atoms have similar radii; (2) both pure materials have same crystal structure; (3) similar electronegativity (otherwise may form a compound instead); (4) solute should have higher valenceExample: Cu-Ni Phase diagram (only for slow cooling conditions)Liquidus line: the line connecting Ts at which liquid starts to solidify under equilibrium conditionsSolidus: the temperature at which the last of the liquid Phase solidifiesBetween liquidus and solidus: P =29 Chapter 853 wt% Ni 47 wt% Cu at 1300oC contains both liquid and solid phases neither of these phases can have average composition 53 wt% Ni 47 wt% Cu draw a tie line at 1300oC from the graph: composition of liquid Phase wL= 45% and solid Phase wS= 58% at 1300oC P = 1F = 3 P = 2 P = 2.
4 F = 3 P = 1 10 Chapter The Lever RuleThe weight percentages of the phases in any 2 Phase region can be calculated by using the lever ruleLet xbe the alloy composition of interest, its mass fraction of B (in A) is C Let Tbe the temperature of interest at T alloy xconsists of a mixture of liquid (with CL- mass fraction of B in liquid) and solid (CS - mass fraction of B in solid Phase )Consider the binary equilibrium Phase diagram of elements A and B that are completely soluble in each otherCoMass fraction of B11 Chapter 8 Lever Rule (cont.)12 Chapter 8Q.:A Cu-Ni alloy contains 47 wt % Cu and 53% of Ni and is at 1300oC. Use and answer the following:A. What is the weight percent of Cu in the liquid and solid phases at this temperature?B. What weight percent of this alloy is liquid and what weight percent is solid?
5 13 Chapter Nonequilibrium Solidification of Alloys constructed by using very slow cooling conditionsAtomic diffusion is slow in solid state; as-cast microstructures show core structures caused by regions of different chemical compositionAs-cast 70% Cu 30% Ni alloy showing a cored structure14 Chapter 8 Nonequilibrium SolidusSolidification of a 70% Ni-30%Cu alloyFig. , SmithSchematic microstructures at T2 and , Smith each core structure will have composition gradient 1- 7 additional homogenizationstep is often required (annealing <T7)15 Chapter Binary Eutectic Alloy System Components has limitedsolid solubility in each other Example: cooling 60%Pb 40%Sn system TeutecticLiquid_a solid solution+ b solid solutionThis eutecticreaction is called an invariantreaction occurs under equilibrium conditions at specific T and alloy compositionF=0at eutecticpoint16 Chapter 8 Solubility Limit.
6 Water-Sugar70 8 010 06040200 Temperature ( C)Co=Composition (wt% sugar)L (liquid solution , syrup)A(70, 20 ) 2 phasesB(100,70) 1 phase2010 0D(100,90) 2 phases4060800L (liquid) + S (solid sugar) Changing T can change # of phases : path Ato B. Changing Cocan change # of phases : path Bto DAdapted from Callister17 Chapter 8 Binary Eutectic Alloy SystemFigure , Smith18 Chapter 8Q: A lead-tin (Pb Sn) alloy contains 64 wt % proeutectic ( ) and 36% eutectic + at 183oC T. Using Figure , calculate the average composition of this Binary Peritectic Alloy SystemThe melting points of the two components are quite differentA liquid Phase reacts with the solid Phase to form a new and different solid phaseLiquid + 20 Chapter 8 Binary Peritectic Alloy System (cont.)
7 21 Chapter Binary monotectic systemsMonotectic reaction: a liquid Phase transforms into a solid Phase and another liquid phaseL1 + L222 Chapter Invariant ReactionsTo summarize: 5 invariant reactions (F = 0)1. EutecticLiquid + 2. Eutectoid + 3. PeritecticLiquid + 4. Peritectoid + 5. MonotecticL1 + L2 The eutectic and eutectoid reactions are similar in that they both involve the decomposition of a single Phase into two solid phases . The oidsuffix indicates that a solid, rather than liquid, Phase is Phase Diagrams with Intermediate phases and CompoundsTerminal Phase :a solid solution of one component in another for which one boundary of the Phase field is a pure componentIntermediate Phase :a Phase whose composition range is between those of terminal phases24 Chapter 8Ti-Si-O system Experiment (700-1000oC)Ti + SiO2 Ti5Si3and TiOy At equilibrium the system will be in TiSix TiOy SiO2three Phase region (from calculations) Ti5Si3 TiO SiO2three Phase region determined experimentally and remaining tie lines can be inferred25 Chapter Ternary Phase DiagramF + P = C + 2 For p = 1atm, T = const (isoterms)Cr-Fe-Ni alloy stainless steel26 Chapter 8 Three and four component systemAB + AC = 2A + BC G = (2GA+ GBC) (GAB+ GAC)If G <0, there is tie line between A and BCThe remaining tie lines cannot crossABCCBABACAB + AC + AD = 3A + BCD G = (3GA+ GBCd) (GAB+ GAC + GAD)
8 Two Phase equilibrium is represented by a tie line If G <0, there is a tie line between A and BCD; otherwise plane connects AB-AC-AD27 Chapter 8 The Ti-Si-N-O quaternary Phase diagram Entire Phase diagram can be calculated by taking into account all possible combinations of reactions and products 4 ternary Diagrams of Ti-Si-N, Ti-N-O, Ti-Si-O and Si-N-O were evaluated additional quaternary tie lines from TiN to SiO2and , et al., 68(3) (1990) 1043 stable metallization bilayer of TiN and TiSi2in contact with , et al., (10) (2004) 2253