Transcription of Chapter 9: Phase Diagrams - Florida International University
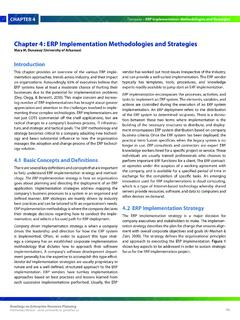
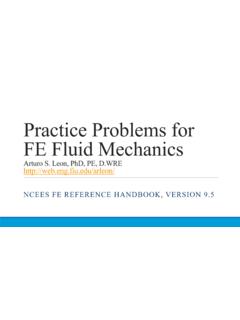
1 Chapter 9 -1 ISSUES TO When we combine two equilibrium state do we get? In particular, if we composition ( , wt% Cu - wt% Ni), and--a temperature (T) many phases do we get?What is the composition of each Phase ?How much of each Phase do we get? Chapter 9: Phase DiagramsPhase BPhase ANickel atomCopper atomChapter 9 -2 Phase Equilibria: Solubility LimitIntroduction Solutions solid solutions, single Phase Mixtures more than one Phase Solubility Limit:Max concentration forwhich only a single Phase solution :What is thesolubility limit at 20 C?Answer: 65 wt% Co< 65 wt% sugar:syrupIf Co> 65 wt% sugar:syrup + Phase DiagramPure SugarTemperature ( C)020406080100Co=Composition (wt% sugar)L(liquid solution , syrup)Solubility LimitL(liquid) + S(solid sugar)20406080100 Pure WaterAdapted from Fig.
2 , Callister 9 -3 Components:The elements or compounds which are present in the mixture( , Al and Cu) Phases:The physically and chemically distinct material regionsthat result ( , and ). Aluminum-CopperAlloyComponents and Phases (darker Phase ) (lighter Phase )Adapted from Chapter -opening photograph, Chapter 9, Callister 3e. A Phase maybe defined as a homogeneous portion of a system that has uniform physical and chemical 9 -4 Effect of T& Composition (Co) Changing Tcan change # of phases: Adapted from Fig. , Callister (100 C,90)2 phases B(100 C,70)1 Phase path Ato B. Changing Cocan change # of phases:path Bto (20 C,70)2 phases70 801006040200 Temperature ( C)Co=Composition (wt% sugar)L(liquid solution , syrup)201004060800L(liquid) + S(solid sugar)water-sugarsystemChapter 9 -5 Phase EquilibriumEquilibrium: minimum energy state for a given T, P, and composition ( equilibrium state will persist indefinitely for a fixed T, P and composition).
3 Phase Equilibrium: If there is more than 1 Phase present, Phase characteristics will stay constant over Diagrams tell us about equilibrium phases as a function of T, P and composition (here, we ll always keep P constant for simplicity). Chapter 9 -6 Unary SystemsTriple pointChapter 9 -7 Phase (nm)electronegCrystalStructure Both have the same crystal structure (FCC) and have similar electronegativities and atomic radii (W. Hume Rothery rules) suggesting high mutual solubility. Simple solution system( , Ni-Cu solution) Ni and Cu are totally miscible in all 9 -8 Unary SystemsSingle component systemConsider 2 metals:Cu has melting T = 1085oCNi has melting T = 1453oC (at standard P = 1 atm)1085oCCusolidliquidT1453oCNisolidliq uidTWhat happens when Cu and Ni are mixed?
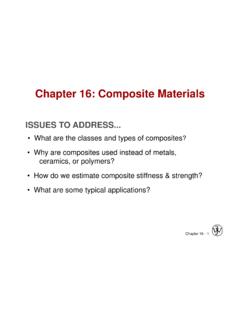
4 Chapter 9 -9 Binary Isomorphous Systems2 componentsComplete liquid and solid solubility1085oCCusolidliquidT1453oCNiso lidliquidTwt% Ni0100 Expect Tmof solution to lie in between Tmof two pure componentsFor a pure component, complete melting occurs before T increases (sharp Phase transition).But for multicomponentsystems, there is usually a coexistence of L and 9 -10 Phase Diagrams Indicate phases as function of T, Co, and P. For this course:-binary systems: just 2 variables: Tand Co(P= 1 atm is almost always used). PhaseDiagramfor Cu-NisystemAdapted from Fig. (a), Callister 7e.(Fig. (a) is adapted from Phase Diagrams of Binary Nickel Alloys, P.)
5 Nash (Ed.), ASM International , Materials Park, OH (1991). 2 phases:L(liquid) (FCC solid solution) 3 Phase fields: LL+ wt% Ni20406080100010001100120013001400150016 00T( C)L(liquid) (FCC solid solution)L+ liquidussolidusChapter 9 -11wt% Ni20406080100010001100120013001400150016 00T( C)L(liquid) (FCC solid solution)L+ liquidussolidusCu-NiphasediagramPhase Diagrams :# and types of phases Rule 1:If we know Tand Co, then we know:--the # and types of phases present. Examples:A(1100 C, 60): 1 Phase : B(1250 C, 35): 2 phases: L+ Adapted from Fig. (a), Callister 7e.(Fig. (a) is adapted from Phase Diagrams of Binary Nickel Alloys, P. Nash (Ed.), ASM International , Materials Park, OH, 1991).
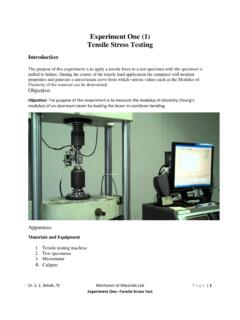
6 B(1250 C,35)A(1100 C,60) Chapter 9 -12wt% Ni2012001300T( C)L(liquid) (solid)L+ liquidussolidus304050L+ Cu-Ni systemPhase Diagrams :composition of phases Rule 2:If we know Tand Co, then we know:--the composition of each Phase . Examples:TAA35Co32 CLAt TA= 1320 C: Only Liquid (L) CL= Co( = 35 wt% Ni)At TB= 1250 C: Both and LCL= Cliquidus( = 32 wt% Ni here) C = Csolidus( = 43 wt% Ni here)At TD= 1190 C: Only Solid ( ) C = Co( = 35 wt% Ni)Co= 35 wt% NiAdapted from Fig. (b), Callister 7e.(Fig. (b) is adapted from Phase Diagramsof Binary Nickel Alloys, P. Nash (Ed.), ASM International , Materials Park, OH, 1991.)BTBDTDtie line4C 3 Chapter 9 -13 Determining Phase composition in 2- Phase region:1.
7 Draw the tie Note where the tie line intersects the liquidus and solidus lines ( where the tie line crosses the Phase boundaries).3. Read off the composition at the boundaries:Liquid is composed ofCLamount of Ni ( wt% Ni).Solid is composed ofC amount of Ni ( wt% Ni). Chapter 9 -14 Rule 3:If we know Tand Co, then we know:--the amount of each Phase (given in wt%). Examples:At TA: Only Liquid (L) WL= 100 wt%, W = 0At TD:Only Solid ( ) WL= 0, W = 100 wt%Co= 35 wt% NiAdapted from Fig. (b), Callister 7e.(Fig. (b) is adapted from Phase Diagrams of Binary Nickel Alloys, P. Nash (Ed.), ASM International , Materials Park, OH, 1991.) Phase Diagrams :weight fractions of phaseswt% Ni2012001300T( C)L(liquid) (solid)L+ liquidussolidus304050L+ Cu-Ni systemTAA35Co32 CLBTBDTDtie line4C 3 RSAt TB:Both and L% 7332433543wt= == 27 wt%WL=SR+SW =RR+SChapter 9 -15 Lever Rule: DerivationSince we have only 2 phases:1=+ WWLC onservation of mass requires that:Amount of Ni in - Phase + amount of Ni in liquid Phase = total amount of NioroLLCCWCW=+ (1)(2)From 1stcondition, we have: LWW =1 Sub-in to (2):oLLLCCWCW=+ )1(Solving for WLand W gives.
8 LoLCCCCW = LLoCCCCW = Chapter 9 -16 Tie line connects the phases in equilibrium with each other - essentially an isothermThe Lever RuleHow much of each Phase ?Think of it as a lever (teeter-totter)MLM RSRMSML = LLLLLLCCCCSRRWCCCCSRSMMMW =+= =+=+= 00 wt% Ni2012001300T( C)L(liquid) (solid)L+ liquidussolidus304050L+ BTBtie lineCoCLC SRAdapted from Fig. (b), Callister 9 -17wt% Ni20120 0130 0304050110 0L(liquid) (solid)L+ L+ T( C)A35 CoL: 35wt%NiCu-Nisystem Phase diagram:Cu-Ni system. System , 2 components:Cu and , completesolubility of onecomponent inanother; phasefield extends from0 to 100 wt% from Fig. , Callister 7e.
9 ConsiderCo= 35 wt% : Cooling in a Cu-Ni Binary46354332 : 43 wt% NiL: 32 wt% NiL: 24 wt% Ni : 36 wt% NiB : 46 wt% NiL: 35 wt% NiCDE2436 Chapter 9 -18 microstructures in Isomorphous AlloysMicrostructures will vary on the cooling rate ( processing conditions)1. Equilibrium Cooling: Very slow cooling to allow Phase equilibrium to be maintained during the cooling (T>1260oC): start as homogeneous liquid (T= 1250oC): calculate composition and mass fraction of each = 43 wt% Ni; CL= 32 wt% Nid(T~ 1220oC): solidus line reached. Nearly complete solidification. C = 35 wt% Ni; CL = 24 wt% Nie(T<1220oC): homogeneous solid solution with 35 wt% (T ~ 1260oC): liquidus line reached.
10 Phase begins tonucleate. C = 46 wt% Ni; CL = 35 wt% NiChapter 9 -19 Non-equilibrium coolingSince diffusion rate is especially low in solids, consider case where:Cooling rate >> diffusion rate in solidCooling rate << diffusion rate in liquid(equilibrium maintained in liquids Phase ) Chapter 9 -20 Non-equilibrium coolinga (T>1260oC): start as homogeneous liquid (T= 1250oC): solids that formed at pt b remain with same composition (46wt%) and new solids with 42 wt% Ni form around the existing solids (Why around them?).d (T~ 1220oC): solidus line reached. Nearly complete solidification. Previously solidified regions maintain original composition and further solidification occurs at 35 wt% (T<1220oC): Non-equilibrium solidification complete (with Phase segregation).