Transcription of CHAPTER EIGHT - ESCAP
1 170 CHAPTER EIGHTINTRODUCTIONW aste is an unavoidable by-product of mosthuman activity. Economic development and risingliving standards in the Asian and Pacific Region haveled to increases in the quantity and complexity ofgenerated waste , whilst industrial diversification andthe provision of expanded health-care facilities haveadded substantial quantities of industrial hazardouswaste and biomedical waste into the waste streamwith potentially severe environmental and humanhealth consequences. The CHAPTER discusses thegeneration, treatment, disposal and management ofthe growing volume of waste .
2 Which poses formidablechallenges to both high and low-income countries ofthe OF and CharacteristicsA clear appreciation of the quantities andcharacteristics of the waste being generated is a keycomponent in the development of robust andcost-effective solid waste management amongst some of the more developedcountries within the region the quantification andcharacterization of waste forms the basis formanagement and intervention, elsewhere littlepriority is given to the systematic surveying of wastearisings and the quantities, characteristics, seasonalvariations and future trends of waste generation arepoorly understood.
3 Although there is a lack ofcomprehensive or consistent information, at thecountry level, some broad trends and commonelements are general, the developed countries generatemuch higher quantities of waste per capita comparedto the developing countries of the region. However,in certain circumstances the management of evensmall quantities of waste is a significant example, in the small islands of the South Pacificsubregion, small populations and modest economicactivity have ensured that relatively low quantitiesof waste are generated.
4 However, many of thesecountries, particularly small atoll countries such asKiribati, Tuvalu and the Marshall Islands, faceconsiderable waste management challenges due totheir small land areas and resultant lack of the region, the principal sourcesof solid waste are residential households and theagricultural, commercial, construction, industrial andinstitutional sectors. A breakdown of solid wastetypes and sources is provided in Table For thepurposes of this review these sources are defined asgiving rise to four major categories of waste :municipal solid waste , industrial waste , agriculturalwaste and hazardous waste .
5 Each of these wastetypes is examined separately Solid WasteMunicipal solid waste (MSW) is generated fromhouseholds, offices, hotels, shops, schools and otherinstitutions. The major components are food waste ,paper, plastic, rags, metal and glass, althoughdemolition and construction debris is often includedin collected waste , as are small quantities ofhazardous waste , such as electric light bulbs, batteries,automotive parts and discarded medicines and Types of Solid WastesSourceTypical waste generatorsTypes of solid wastesResidentialSingle and multifamilydwellingsFood wastes, paper,cardboard, plastics, textiles,leather, yard wastes, wood,glass, metals, ashes, specialwastes ( bulky items.)
6 Consumer electronics, whitegoods, batteries, oil, tires),and household hazardouswastesHousekeeping wastes,packaging, food wastes,construction anddemolition materials,hazardous wastes, ashes,special wastesPaper, cardboard, plastics,wood, food wastes, glass,metals, special wastes,hazardous wastesSame as commercialWood, steel, concrete, dirt, sweepings, landscapeand tree trimmings, generalwastes from parks, beaches,and other recreational area,sludgeIndustrial process wastes,scrap materials, off-specification products, slag,tailingsLight and heavymanufacturing,fabrication.
7 Constructionsites, power and chemicalplantsIndustrialCommercialStores , hotels, restaurants,markets, office buildings, , hospitals,prisons, governmentcentresNew construction sites,road repair, renovationsites, demolition ofbuildingsStreet cleaning,landscaping, parks,beaches, otherrecreational areas, waterand wastewater treatmentplantsHeavy and lightmanufacturing, refineries,chemical plants, powerplants, mineral extractionand processingInstitutionalConstructionandde molitionMunicipalservicesProcessAgricult ureAll of the above should be included as municipal solid waste . Crops, orchards,vineyards, dairies,feedlots, farmsSpoiled food wastes,agricultural wastes,hazardous wastes ( )171 WASTEG eneration rates for MSW vary from city tocity and from season to season and have a strongcorrelation with levels of economic development andactivity.
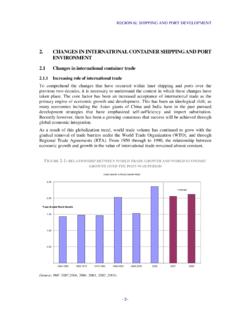
8 High-income countries (such as Australia,Japan, Hong Kong, China, Republic of Korea, andSingapore) produce between and kg/capita/day; middle-income countries (such as Indonesia,Malaysia and Thailand) generate between kg/capita/day, whilst low-income countries (suchas Bangladesh, India, Viet Nam and Myanmar) havegeneration rates of between and kg/capita/day. Figure shows MSW generation by the high,middle and low-income countries of the as a whole, the Asian and Pacific Regioncurrently produces some million tonnes of MSWeach day and this is expected to more than doubleby 2025 (World Bank 1999).
9 The current estimate forwaste generation may be considered as extremelyconservative; the actual levels are probably more thandouble this amount. Figure presents the currentcontribution of the various subregions to the wastegenerated by the region (United Nations 1995, WorldBank 1995 and 1998, UNEP/SPREP 1997).The composition of municipal solid wastevaries significantly across the region (see Figure )with some middle and low income countriesgenerating waste containing over 70 per cent organiccontent, with a corresponding moisture content inexcess of 50 per cent.
10 Differences in thecharacterization and reporting of waste types alsodiffer with some municipal authorities includingconstruction and demolition waste and industrialwaste as part of the municipal waste inter-urban differences relate to climateand fuel use. The cities where heating is needed inwinter such as Beijing, Shanghai, Seoul and Tokyoand where coal is the main source of energy, havemuch greater amount of ash in the waste in quantityHigh-income countriesMiddle-income countriesLow-income countriesMillion tonnesYearFigure Solid waste generation inDifferent Groups of Countries in theRegionSource:World Bank 1999 Figure Approximate Composition of MunicipalSolid waste in Selected Cities of ESCAPM ember CountriesSource.