Transcription of CHAPTER Hypothesis Testing with One Sample
1 CHAPTER 7346 Hypothesis Testing with One to Hypothesis Testing for the Mean (s Known) Testing for the Mean (s Unknown)ActivityCase Testing for Testing for Variance and Standard DeviationUses and AbusesReal Statistics Real DecisionsTechnologyThe Entertainment Software Rating Board (ESRB) assigns ratings to video games to indicate the appropriate ages for players. These ratings include EC (early childhood), E (everyone), E10+ (everyone 10+), T (teen), M (mature), and AO (adults only).Copyright Pearson. All Rights CHAPTER . NOT FOR DISTRIBUTION. 347 Where You re GoingIn this CHAPTER , you will continue your study of inferential statistics.
2 But now, instead of making an estimate about a population parameter, you will learn how to test a claim about a instance, suppose that you work for Pew Research Center and are asked to test a claim that the proportion of adults who agree that people who play violent video games are more likely to be violent themselves is p= To test the claim, you take a random Sample of n=2001 adults and find that 800 of them think that people who play violent video games are more likely to be violent themselves. Your Sample statistic is np your Sample statistic different enough from the claim 1p= to decide that the claim is false?
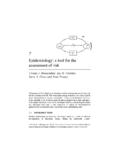
3 The answer lies in the sampling distribution of Sample proportions taken from a population in which p= The figure below shows that your Sample statistic is more than 4 standard errors from the claimed value. If the claim is true, then the probability of the Sample statistic being 4 standard errors or more from the claimed value is extremely small. Something is wrong! If your Sample was truly random, then you can conclude that the actual proportion of the adult population is not In other words, you tested the original claim ( Hypothesis ), and you decided to reject You ve BeenIn CHAPTER 6, you began your study of inferential statistics.
4 There, you learned how to form a confidence interval to estimate a population parameter, such as the proportion of people in the United States who agree with a certain statement. For instance, in a nationwide poll conducted by Pew Research Center, 2001 adults were asked whether they agreed or disagreed with the statement, People who play violent video games are more likely to be violent themselves. Out of those surveyed, 800 adults agreed with the have learned how to use these results to state with 95% confidence that the population proportion of adults who agree that people who play violent video games are more likely to be violent themselves is between and 6 5 4 3 2 = statisticp z DistributionCopyright Pearson.
5 All Rights CHAPTER . NOT FOR to Hypothesis CHAPTER 7 Hypothesis Testing with One SampleWhat You Should Learn A practical introduction to Hypothesis tests How to state a null Hypothesis and an alternative Hypothesis How to identify type I and type II errors and interpret the level of significance How to know whether to use a one-tailed or two-tailed statistical test and find a P@value How to make and interpret a decision based on the results of a statistical test How to write a claim for a Hypothesis testHypothesis Tests Stating a Hypothesis Types of Errors and Level of Significance Statistical Tests and P-Values Making a Decision and Interpreting the Decision
6 Strategies for Hypothesis TestingHypothesis TestsThroughout the remainder of this text, you will study an important technique in inferential statistics called Hypothesis Testing . A Hypothesis test is a process that uses Sample statistics to test a claim about the value of a population parameter. Researchers in fields such as medicine, psychology, and business rely on Hypothesis Testing to make informed decisions about new medicines, treatments, and marketing instance, consider a manufacturer that advertises its new hybrid car has a mean gas mileage of 50 miles per gallon. If you suspect that the mean mileage is not 50 miles per gallon, how could you show that the advertisement is false?
7 Obviously, you cannot test all the vehicles, but you can still make a reasonable decision about the mean gas mileage by taking a random Sample from the population of vehicles and measuring the mileage of each. If the Sample mean differs enough from the advertisement s mean, you can decide that the advertisement is instance, to test that the mean gas mileage of all hybrid vehicles of this type is m=50 miles per gallon, you take a random Sample of n=30 vehicles and measure the mileage of each. You obtain a Sample mean of x=47 miles per gallon with a Sample standard deviation of s= miles per gallon.
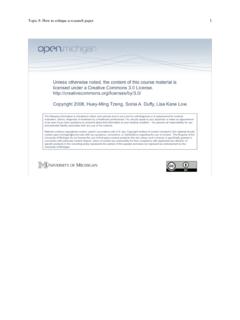
8 Does this indicate that the manufacturer s advertisement is false?To decide, you do something unusual you assume the advertisement is correct! That is, you assume that m=50. Then, you examine the sampling distribution of Sample means ( with n=30) taken from a population in which m=50 and s= From the Central Limit Theorem, you know this sampling distribution is normal with a mean of 50 and standard error the figure below, notice that the Sample mean of x=47 miles per gallon is highly unlikely it is about 3 standard errors 1z from the claimed mean! Using the techniques you studied in CHAPTER 5, you can determine that if the advertisement is true, then the probability of obtaining a Sample mean of 47 or less is about This is an unusual event!
9 Your assumption that the company s advertisement is correct has led you to an improbable result. So, either you had a very unusual Sample , or the advertisement is probably false. The logical conclusion is that the advertisement is probably mean46 4748 4950 5152 5354 4 3 2 101234xz = 50 Sample meanx = 47z Distribution of xStudy Tip As you study this CHAPTER , do not get confused regarding concepts of certainty and importance. For instance, even if you were very certain that the mean gas mileage of a type of hybrid vehicle is not 50 miles per gallon, the actual mean mileage might be very close to this value and the difference might not be Pearson.
10 All Rights CHAPTER . NOT FOR DISTRIBUTION. SECTION Introduction to Hypothesis Testing 349 Stating a HypothesisA statement about a population parameter is called a statistical Hypothesis . To test a population parameter, you should carefully state a pair of hypotheses one that represents the claim and the other, its complement. When one of these hypotheses is false, the other must be true. Either Hypothesis the null Hypothesis or the alternative Hypothesis may represent the original A null Hypothesis H0 is a statistical Hypothesis that contains a statement of equality, such as .., =, or .2. The alternative Hypothesis Ha is the complement of the null Hypothesis .