Transcription of CHAPTER I V: Waste Management Introduction
1 CHAPTER IV: Waste Management CHAPTER IV: Waste Management Introduction Waste Management is a challenging issue from an environmental, political, legal and social point of view. G rowth of large urban areas, tourist flow, rise of living standards and change of consuming patterns, have led to an increase of the produced volumes of municipal Waste with a simultaneous change of its composition. At the same time, there is a growing concern on the site allocation for Waste Management installations. Furthermore, until recently, big quan tities of useful materials ( paper, glass, aluminium, plastic, metal and wood) have not been, in some cases, exploited to their full potential, through recovery and recycling. However, n i recent years, significant progress has been accomplished in solid Waste Management , through increased allocation of funds, focusing largely on the promotion of recycling and the expansion of the number of managed sanitary landfill sites through out the country.
2 Greece, as an EU member state has incorporated into its national legislation and is implementing all related European Community Waste Management legislation. Thus, Waste Management is fully covered by a wide range of enactments for all Waste types, hazardous and non -hazardous, municipal, industrial, hospital etc. Moreover, all means and options for Waste Management are also fully covered by corresponding technical specifications, from collection, transportation and transfer, to processing, utilisation, incineration and final disposal/landfilling. Within thi s context, a series of more detailed technical enactments regulate particular issues like Waste Management sites (hazardous, non- hazardous, municipal and inert); small sanitary landfills; the technical specifications of Management projects ; Waste incineration; Management of hospital and hazardous Waste ; as well as the processes for alternative Management of specific Waste streams like packaging material, used ty res, end-of-life vehicles (ELVs), used lubricants, batteries and accumulators, Waste of electric and electronic equipment (WEEEs) etc.
3 Solid Waste : state and impacts i. Solid Waste Over recent years, total Waste generation in Greece has presented an increasing trend. Mineral and solidified Waste represented % of total Waste in 2006. B etween 1990 and 2007, municipal Waste generation increased by %, from 3,075 kt to 5,002 kt. The main contributors in 2007 were putrescibles ( %), paper (22 %) and plastic ( %) (NCESD, 2010). In terms of landfills, many fully engineered sanitary landfills are in operation throughout the country; currently unmanaged sites have been or are being rehabilitated while the ones still in operation (155) are expected to be fully closed soon. ii. Packaging Waste Between 1997 and 2007, packaging Waste generation increased by %, from kt to kt. Glass, metals, paper and fibre board, and plastics accounted in 2007 for the majority of packaging Waste generated (94 %).
4 The EU target to recycle 25 % of packaging Waste in 2001 has been met and exceeded (33 %). In 2007, the average recycling rate over Greece reached 48 %, with Paper and Fibre Board having the biggest shares ( % in 2007) followed by glass, metals, plastic and wood. iii. Batteries Use of portable batteries and accumulators slightly decreased (9 %) between 2007 and 2008, while the amount of collected batteries increased by 12 %. Table 1: Batteries and Accumulators Portable batteries and accumulators (t) 2007 2008. Used 2100 1908. Collected 442 496. Industrial and automotive batteries and accumulators (t). Used 41 000 41 000. Collected lead and acid batteries 32 000 32 500. Source: National Centre of Environment and Sustainable Development (NCESD), 2010. 34. CHAPTER IV: Waste Management iv.
5 WEEE. Between 2007 and 2008, recycling of WEEE increased by 50 %. In 2007, the WEEE collected for recycling represented % of the total annual amount of 44,000 tonnes, which is the national target under the EU directive. In 2008, the EU collection target was surpassed (44,300 t). Table 2: WEEEs trends WEEE (t) 2007 2008. Generation 170 000 175 000 190 000 200 000. Recycled Source: National Centre of Environment and Sus tainable Development (NCESD), 2010. v. Construction and Demolition Waste Rough estimations indicate a production of around 12-15 million tonnes annually, in 2010. vii. ELV. In 2007, collected ELVs amounted to 66,000 with a recycled rate of around 84 % ( 49,000), thus exceeding the EU target of 80 %. viii. Hazardous Waste Hazardous Waste slightly decreased since 2004 (by %), whereas recycling of hazardous Waste increased by % and incineration by 80 %.
6 In more detail, around 330,000 tonnes of hazardous Waste are being generated annually in Greece, principally by industry, healthcare facilities and transport activities. Overall, 42% of total hazardous Waste production is oil and liquid fuel Waste (which is almost all recovered); is end-of-life and out-off-specification products and is Waste from thermal processes, especially steel and aluminium. Hazardous Waste are mainly produced in Attica ( ), Central Macedonia ( ), Sterea Ellada ( ), Thessaly ( ) and Western Greece ( ). Of the total volume of hazardous Waste produced, 4,442 tonnes were exported in 2006, compared to 3,262 tonnes in 2003 and 905. tonnes in 2001. The largest amounts of hazardous Waste exported were biocides and phytopharmaceuticals, Waste dyes, inks and paints, and PCBs (polychlorinated biphenyls).
7 Greece imports only Waste oils and lead batteries for recovery purposes. Greece has not imported hazardous Waste for disposal. Table 3: Hazardous Waste production Hazardous Waste (t) 2004 2005 2006. Total 335, 333, 333, Recycling 111, 109, 118, Incinaration 1, 2, 2, Energy recovery 5, 7, 7, Landfill 13, 7, 14, Other 202, 207, 189, Source: National Centre of Environment and Sustainable Development (NCESD), 2010. Key drivers, pressures and trends of solid Waste generation Between 1991 and 2001, the Greek population increased with an average annual population growth rate of %. This rate is estimated to decline from % in 2005 to % in 2020, according to data from the Hellenic Statistical Authority (ELSTAT). The number of individuals per household is estimated to decrease, reflecting ageing of population and new living arrangements.
8 The majority of Waste streams derive from Industry, Construction and Agriculture. The industrial sector represents % of total Waste generation in 2006. Due to variations in tourism demands over time (mainly summer) and space (many islands and coastal areas), population can increase locally two to ten times, affecting municipal Waste generation. Municipal Waste generation per capita has an annual increase rate of % since 2003, whereas GDP increased over the period 2003-2007 with an annual rate of %. Therefore, the generation of Waste has shown a relative decoupling from the country's economic growth. Packaging Waste generation in Greece presents a significant decoupling from GDP. growing by % between 2000 and 2007. At the same time, real GDP increased by % and recycling of packaging Waste increased by 62 %.
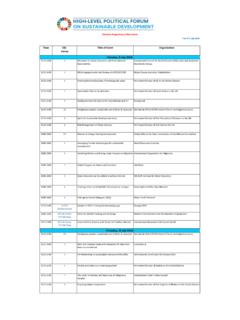
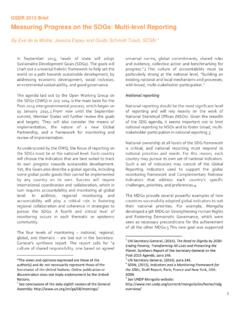
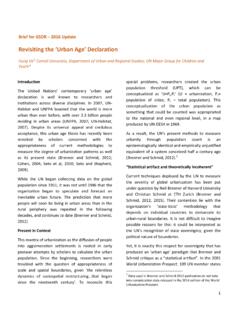
9 Over the decade 1997-2007, per capita packaging Waste generation increased by % (from kg per person to kg per person), while per capita recycling showed an overall increase of 58 %. 35. CHAPTER IV: Waste Management Figure 1: Generation of Waste by Waste category Figure 2: Generatio n of Waste by Waste category (2004, 2006) (2006). 60000 Chemical and medical Waste materials and wastes equipment 50000 Mineral and solidified Animal and vegetal wastes wastes Common sludges 40000. Mixed ordinary wastes Animal and vegetal Mixed ordinary wastes 30000 wastes Kt Waste materials and equipment Chemical and medical Common sludges 20000 wastes 10000. Mineral and solidified 0 wastes 2004 2006 Figure 3: Estimated composition (%) of MW Figure 4: Generation of packaging Waste by Waste generated (1990-2007) type (1997- 2007).
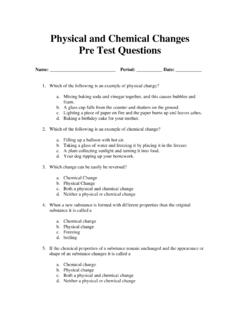
10 100 100%. 90. 80 80%. Rest 70 Glass 60%. Percentage 60 Metals Shares (%). Plastics 50. Paper 40%. 40 Wood 30 Textiles Putrescibles 20%. 20. 10. 0%. 0 1997 1998 1999 2000 2001 2002 2003 2004 2005 2006 2007. 1990. 1991. 1992. 1993. 1994. 1995. 1996. 1997. 1998. 1999. 2000. 2001. 2002. 2003. 2004. 2005. 2006. 2007. Glass Plastic Paper and fibre board Metals Composites Wood Source: National Centre of Environment and Sustainable Development (NCESD), 2010. Figure 5: Recycling of packaging Waste Figure 6: Recycling of packaging Waste by Waste type (1997-2007) (1997- 2007). 100 100%. 90. 80 80%. 70. 60 60%. Percentage Percentage (%). 50. 40 40%. 30. 20 20%. 10. 0 0%. 1997 1998 1999 2000 2001 2002 2003 2004 2005 2006 2007 1997 1998 1999 2000 2001 2002 2003 2004 2005 2006 2007. Recycling rate Minimum target 2001 - 25% Minimum target 2008 - 55% Glass Plastic Paper and Fibre Board Metals Composites Wood Source: National Centre of Environment and Sustainable Development (NCESD), 2010.