Transcription of Characterization of Polymers Using TGA
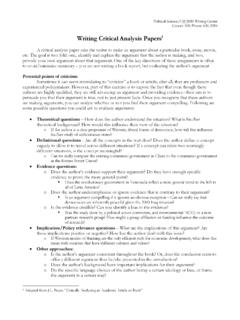
1 Application note Characterization of Polymers Using TGA. Sichina, Marketing Manager Compositional analysis of The extended capabilities of the Introduction multi-component materials or PerkinElmer TGA, as a valuable tool blends for polymeric Characterization and Thermal stabilities quality assurance are demonstrated by Thermogravimetric analysis (TGA) these applications. Oxidative stabilities is one of the members of the family of thermal analysis techniques used Estimation of product lifetimes Decomposition kinetics Thermal Stabilities and Moisture to characterize a wide variety of Content materials. TGA provides compli- Effects of reactive atmospheres mentary and supplementary on materials Filler content of materials Figure 1 shows the TGA results Characterization information to the generated on nylon 6,6 toothbrush most commonly used thermal Moisture and volatiles content bristles. The plot shows the percent technique, DSC.
2 Mass as a function of sample PerkinElmer offers a variety of high temperature for the nylon 6,6 bristles TGA measures the amount and rate under a nitrogen purge. (velocity) of change in the mass of a performance TGA instruments encompassing a wide range of Approximately 10 mg of sample was sample as a function of temperature heated at a rate of 20 C/min with the or time in a controlled atmosphere. application needs and operational requirements. All of the TGA PerkinElmer TGA. The measurements are used primarily to determine the thermal instruments feature an optional, and/or oxidative stabilities of state-of-the-art autosampler for materials as well as their reliable, unattended operation. compositional properties. The technique can analyze materials that exhibit either mass loss or gain due to decomposition, oxidation or loss of volatiles (such as moisture). It is especially useful for the study of polymeric materials, including thermoplastics, thermosets, elasto- mers, composites, films, fibers, coatings and paints.
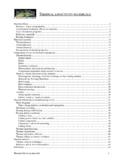
3 TGA measurements provide valuable information that can be used to select materials for certain end-use applications, predict product performance and improve product quality. The technique is particularly useful for the following Figure 1. TGA results obtained for nylon 6,6 bristles types of measurements: showing thermal degradation The TGA results show that the nylon The epoxy resin undergoes thermal option of an automated gas flow and 6,6 polymer undergoes thermal degradation beginning at 440 C gas switching accessory for ease of degradation beginning at 482 C and with a mass loss of At 650 conducting TGA thermo-oxidative with a total mass loss of C, the purge gas flowing over the experiments]. The material remaining There is a small amount of inert sample was automatically switched behind after exposing the sample to residue remaining ( ). to oxygen and the carbon residue oxygen is the inert glass filler, which was burned off at 655 C with a mass the TGA shows comprises of Nylon Polymers absorb a small loss of [The PerkinElmer the mass of the epoxy resin.
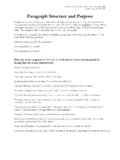
4 Amount of ambient moisture and TGA instruments all feature the TGA can be used to determine this level of water. This may be seen in Figure 2 for the nylon 6,6 sample, which is an enlarged view of the TGA results in the temperature region below the onset of degradation. At about 56 C, the nylon polymer starts to evolve the small amount of moisture, which is found to be by TGA. A high performance TGA instrument is required to detect this small level of moisture content. Knowing this moisture content is important as it has a major bearing on the end use properties and processing performance of nylon. Filler Content in Polymers Figure 2. TGA results showing water wright loss for nylon 6,6. One major application of TGA is the assessment of the filler content in Polymers and composites. The level of fillers can have a significant impact on the end use properties (thermal expansion, stiffness, damping) of the final product.
5 This is particularly important for electronics applications where the level of filler affects the coefficient of thermal expansion (CTE) as measured Using the PerkinElmer TMA. It is important for the components in a printed circuit board to have very similar expan- sivities or else built-in stresses over time can occur. Displayed in Figure 3 are the TGA results generated on a glass filled epoxy resin used for electronic applications. Figure 3. TGA results for epoxy-glass powder 2. Characterization of the toughness properties to the ABS However, Auto Stepwise TGA does Differences in Polymers blend. ABS is typically used for provide the ability to resolve the two housings for personal computers weight loss events and makes the A high performance TGA, such as and other electronic equipment and quantitative compositional analysis of the ones available from Perkin- the material's impact resistance is the ABS possible.
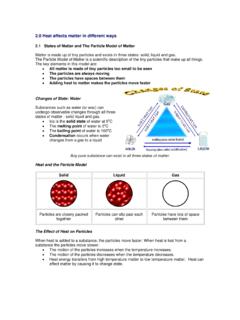
6 This may be seen Elmer, allow for the detection of important for its long term in the Auto Stepwise TGA results subtle, but potentially important, durability. The weight loss obtained on ABS displayed in Figure differences between Polymers . transition of the butadiene rubber 5. The butadiene, rubber component Shown in Figure 4 are the TGA component occurs extremely close is nicely separated from the SAN. results obtained on two different to the decomposition of the SAN decomposition and this provides high density polyethylene (HDPE) copolymer. Standard TGA cannot excellent Characterization information. containers. One is an opaque soap separate out the two events. container while the other is a semi- transparent water bottle. The soap bottle HDPE resin has a slightly, but significantly, higher level of filler ( versus ). This information is important for the production of the containers. Compositional Analysis of Multi-component Polymers One of the most important applications of TGA is the assessment of the compositional analysis of polymeric blends.
7 The compositional Characterization information can be enhanced through the use of Auto Stepwise Figure 4. TGA degradation for two different HDPE bottles TGA, where the TGA instrument automatically heats the sample and then holds it under isothermal conditions when the instrument detects a significant weight loss. This provides the highest possible separation of overlapping decomposition events and provides for the most accurate compositional analysis of Polymers . An example of the ability of the Auto Stepwise approach to provide useful compositional information is in the Characterization of ABS. This is a polymer alloy comprised of a SAN matrix (styrene acrylonitrile copolymer) with butadiene. The butadiene is a rubbery component Figure 5. Auto Stepwise TGA results for ABS showing and provides the desired impact and separation of SAN and butadiene components 3. Another example of the ability of the Auto Stepwise approach to provide outstanding separation of over- lapping weight loss events is for tire elastomers.
8 These elastomers consist of a blend of polymer , oil extender, carbon black and fillers. It is difficult to separate out the oil from the polymer Using standard TGA since the two events severely overlap. However, with the Auto Stepwise approach, all of the components in a tire elastomer can be clearly identified as is shown in Figure 6. This information is valuable for the production of an automotive tire with the desired end use and long term properties. Measurement of Low Level of Volatiles Figure 6. Auto Stepwise TGA compositional results for tire elastomer Many polymer applications are showing separation of oil, polymer , carbon black and filler sensitive to occurrence of low level volatilization. On a large production basis, even a small level of volatiles ( , less than 1%) can have a major impact on the processing of the Low Level of Volatiles polymer . It is known that low levels of volatiles can affect the injection from PET Resin at 130 C.
9 Molding or blow molding processing Single Pellet of Polymers . Shown in Figure 7 is the low level of volatilization obtained for a single pellet of PET. resin. This measurement was performed holding the sample under gentle isothermal conditions at 130. C. The mass loss observed at 10. hours was for the PET. pellet. This is an important aspect for PET resins used to make beverage containers as low levels of soluble volatile components can affect the taste of the beverage. The high performance TGA instruments Figure 7. Low level emission of volatiles from single PET chip under from PerkinElmer provide the high gentle isothermal conditions at 130 C. degree of sensitivity and stability to make these long term measurements possible. 4. TGA Decomposition Kinetics for Lifetime Predictions TGA decomposition information can be used to predict the useful product lifetimes of some polymeric materials, such as the coatings for electrical or telecommunication cables.
10 The sample is heated at three or more different heating rates. The use of the different heating changes the time scale of the decomposition event. The faster the applied heating rate, the higher the given decomposition temperature becomes. This approach establishes a link between time and temperature for the polymer decomposition and this information can be used to model the decomposition kinetics. Figure 8. Effect of heating heat on thermal decomposition of polyethylene Shown in Figure 8 are the TGA. results generated on a sample of polyethylene at heating rates ranging from 1 to 40 C/min. As the heating rate is increased, the onset of decomposition is moved to higher temperatures. This data can then be analyzed Using the PerkinElmer TGA Decomposition Kinetics Software. The kinetics analysis provided by the software provides valuable predictive information on polymeric materials, including lifetime estimations.