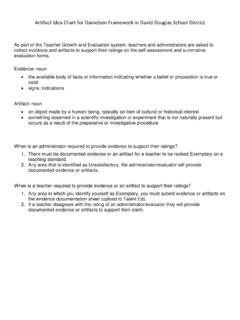
Transcription of Chart #35 – Behavior Observation Tally Sheet
1 Chart #35 Behavior Observation Tally Sheet Purpose The purpose of Chart #35 is to allow the teacher to collect date on a target Behavior using frequency counts, duration, or intervals. Therefore, the Chart is versatile and can be modified to fit any situation or Behavior . Behaviors Investigated Chart #35 is a very versatile instrument because it can be used to collect data on behavioral frequency ( , hitting, talking, out of seat), duration ( , tantrums), or interval ( , on/off task). Since the Chart is so versatile, any Behavior that is observable and measurable can be measured with this instrument. Directions The first step to completing this Chart is to define the target behaviors and decide on the type of recording that will provide the most useful data.
2 When conducting a frequency count, the teacher will simply mark an X in the box each time the Behavior occurs. To find the percentage, the teacher will divide the number of occurrence by the number of occurrences plus non-occurrences. When measuring duration, each cell represents one minute, and X is place in the box when the Behavior begins, ends, and each box in between. To find the average duration, the total time is added and divided by the total number of occurrences. When using this Chart as an interval-recording instrument, each cell represents one minute. During the observational period, an X is placed in the corresponding cell if the Behavior occurs during the specified time period. To find the rate of the Behavior , the sum of the occurrence intervals is divided by the total number of intervals.
3 In addition to the versatility of the instrument, teachers can write qualitative data in the comments section to provide a better understanding of the setting and problem Behavior . Behavior Observation Tally SheetDate:12345678910(Ralabate, 2003, p. 34)Additional Observations or Comments:IntervalBehavior Count:Average Duration:Percentage:TotalTally or IntervalsStart TimeStop TimeStudent:Observer:Target Problem Behavior :P = Problem OccurrenceA = Alternate OccurrenceTarget Alternate Behavior :Type of Measurement:FrequencyDurationSetting/Act ivity:Ralabate, P. (2003). Meeting the challenge: Special education tools that work for all kids. Washington, : NEA Professional Observation Tally SheetDate:X123456789109:009:10 PPPP9:109:20 PPAP9:209:30 PPPAA70%Type of Measurement:Inappropriate Verbal Comments (off-task)Appropriate Verbal Comments (on-task)11/11/11 Setting/Activity:Class DiscussionTarget Problem Behavior :Target Alternate Behavior :Start TimeStop TimeTotalTally or IntervalsStudent:Observer:Juan KeeleyFrequencyDurationIntervalBehavior Count:Average Duration:Percentage:7 (30 Min)P = Problem OccurrenceA = Alternate OccurrencePercent (7 out of 10) of Juan's comments were inappropriate.
4 (Ralabate, 2003, p. 34)Additional Observations or Comments:Juan's comments wer directed athis peers. They were funny and seemed to be attempts to gain their offered on 3 "on-task" verbal comments between 9:10 and 9:30. SeventyRalabate, P. (2003). Meeting the challenge: Special education tools that work for all kids. Washington, : NEA Professional Library.