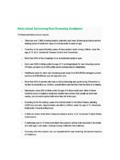
Transcription of child drowning 8
1 child drowning in FloridaSURVEILLANCE DATA: 2014 There were 297 hospitalizations for non-fatal drowning . Children ages 1 4 accounted for of those who died and 41% percent of those 2014, 444 Florida residents died from drowning . EVERYONE IN THE FAMILY SHOULD KNOW HOW TO BARRIERS Make your home pool safer with a 4-sided fence that includes alarms, gates and When children are around or in the pool children should never swim READY Learn CPR and get re-certified every 2 years. Keep a phone and safety equipment near the Teach children how to swim. Not every child is ready to swim at the same age so ask your family MORE: Layersof ProtectionMake Pool Time a Safer TimeFLORIDA VIOLENCE AND INJURY PREVENTIONMost infant drownings occur in bathtubs and 5+ are most likely to drown in natural bodies of ages 1 4 had the highest rates of drowningfatalities and non-fatal ages 1 4 For this age group, drowning is the leading cause of death in Florida.
2 This rate is the highest in the drowning Ratesper 100,000$16,705 was the median admission charge for drowning -related, non-fatal injury hospitalizations.$18 million was the total charges exceededthis days was the median length of number of children who drown each year in Florida could fill 3 4 preschool & Non-Whites DEATHS 105 339 329 94 21 444 95 202 185 77 39 297 NON-FATAL73%Deaths &Non-Fatal drowning Hospitalizations Combined23%Deaths &Non-Fatal drowning Hospitalizations Combined69%Deaths &Non-Fatal drowning Hospitalizations Combined6%Deaths &Non-Fatal drowning Hospitalizations Combined Females Males Whites Blacks Both Sexes, All Races27%Deaths &Non-Fatal drowning Hospitalizations CombinedWho is Injured?Florida and Violence Injury Prevention ProgramWHO PAID?
3 Medicaid, 43%Commercial insurance, 31%Hospitalizations Y E A R R ATE 20 09 2010 2011 2012 2013 Y E A R R ATE 2 0 0 9 2010 2011 2012 2013