Transcription of CHUNYA DISTRICT SOCIO-ECONOMIC PROFILE
1 THE UNITED REPUBLIC OF TANZANIACHUNYA DISTRICTSOCIO-ECONOMIC PROFILEJ oint Publication by:THE PLANNING COMMISSIONDAR ES SALAAMandCHUNYA DISTRICT COUNCILMBEYA i TABLE OF CONTENTS Page SECTION LAND, PEOPLE, CLIMATE AND AGRO ECONOMIC GEOGRAPHICAL LAND ADMINISTRATIVE DEMOGRAPHIC Ethnic Groups: CHUNYA DISTRICT is inhabited by the following ethnic groups:..5 POPULATION SIZE AND POPULATION POPULATION CLIMATE AND VEGETATION:..18 AGRO - ECONOMIC GOLD MINE MIOMBO WOODLAND RUKWA TYPES OF SECTION SOCIAL PRIMARY GROSS ENROLMENT: (PRIMARY SCHOOL ENROLMENT).
2 31 STD 1 PROBLEMS FACING PRIMARY SCHOOL PRIMARY SCHOOL SECONDARY SCHOOL ADULT ii WATER WATER SUPPLY SITUATION IN CHUNYA PROBLEMS FACING RURAL WATER HEALTH EXISTING HEALTH HEALTH MORBIDITY AND INFANT MORTALITY MATERNAL MORTALITY HIV - INFECTION AND AIDS IMMUNIZATION (PERCENTAGE) COVERAGE IN CHUNYA DISTRICT 1985 AND SECTION ECONOMIC AIR MARINE OTHER ENERGY SECTION PRODUCTIVE DISTRICT DISTRICT GDP AND PER CAPITA FOOD CASH FARM iii FARM IRRIGATION FOOD STORAGE LIVESTOCK LIVESTOCK BEEF CATTLE FOOD ADEQUACY AND NUTRITIONAL FOREST PROBLEMS FACING FISHING PROBLEMS FACING THE MINING THE ADVERSE IMPACTS OF GOLD MINING GENERAL INFORMATION ABOUT AREA OF TANZANIA
3 MAINLAND AREA BY REGIONS (SQ KM)..137 TOTAL POPULATION AND LIFE EXPECTANCY FOR TANZANIA - BY REGIONS, 1967, 1978, 1988, LAND ARABLE MOUNTAIN SUMMITS (METRES ABOVE SEA LEVEL)..139 iv (A) SOCIAL HEALTH EDUCATION: ENROLMENT RATES 1990 COMPARED WITH OTHER EAST AFRICA NATIONAL v FOREWORD In the Fiscal Year 1996/97 the Government started to implement its decision of restructuring regional administration and putting in place Local Authorities which are well performing in the way of championing development and delivering of economic and social services to the people.
4 Hitherto (July 1997), the Local Authorities in the country are fragmented, not clear about their mission and as a matter of fact lack skilled manpower, financial resources and basic working equipment. Thus, the government move is in the right direction, aimed at bringing closer to the people the decision making process which entails genuine participation, democracy and self governance as well as the implementation of various development programmes. This is a major shift from the traditional approach of regional focus to current the DISTRICT focus planning and implementation with final goal of devolving powers to ward and village levels.
5 In order to ensure an effective devolution of power, the Local Authorities have to be provided with well trained and qualified staff and the necessary support needed at that level. Staffed with the competent personnel, the Local Authorities are expected as hinted above to prepare and implement their own development plans, which by and large will make use of the existing, locally available resources. vi The availability of reliable, adequate, qualitative and relevant data and information at DISTRICT level is a prerequite for the success of the Local Authorities in their new role of formulating, planning, implementing, monitoring and evaluating their development programmes.
6 The publication of DISTRICT Socio- Profiles Series by the Planning Commission in close collaboration with relevant Local Authorities should be viewed as modest attempt towards finding solutions to the existing problem of data and information gap at local levels. I would like to take this opportunity to acknowledge with thanks, the financial support of the Royal Danish Embassy which facilitated the preparation of CHUNYA DISTRICT SOCIO-ECONOMIC PROFILE . I would also like to thank both the Planning Commission and CHUNYA Council staff who devoted a lot of effort into ensuring the successful completion of this assignment.
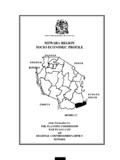
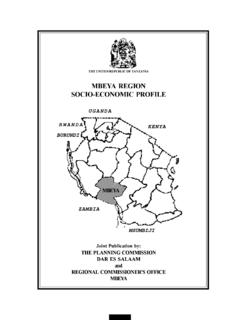
7 Nassoro W. Malocho (MP) MINISTER OF STATE PLANNING AND PARASTATAL SECTOR REFORM vii September, 1997 Dar es Salaam 1 SECTION I LAND, PEOPLE, CLIMATE AND AGRO ECONOMIC ZONES Geographical Location CHUNYA DISTRICT is located in the North - Western part of Mbeya Region. The DISTRICT is among the seven (7) districts of Mbeya region and it lies between 7o and 9o Latitudes South of the Equator, and between 32o and 34o Longitudes East of Greenwich. The DISTRICT is bordered by Singida and Tabora regions to the North; Iringa region and Mbarali districts to the East; Mbozi and Mbeya districts to the South; Rukwa region and lake Rukwa to the West.
8 Land Area The DISTRICT has a total area of 29,219 (29,219,000 ha.) of which 28,114 (28,114,000 ha.) is land and 1,705 (1,705,000 ha.) is covered with water including rivers Songwe, Lupa, Zira and Part of Lake Rukwa which constitute the inland water bodies. The total land area of the DISTRICT is classified as shown in Tables I(a), I(b) and charts 1 and 2 below: TABLE I (a): LAND CLASSIFICATION IN CHUNYA DISTRICT 2 Classification Area in Sq. Kms. Area in Ha. Area Share (%) Arable land Game Reserves Forest Reserves Water bodies Others 23,005 2,000 1,105 2, 3,005,000 2,000,000 396,400 1,105,000 2,712,600 Source: CHUNYA DISTRICT Council Chart 1: Land Classification in Sq.
9 Km in CHUNYA DISTRICT 3 Game reserves7%Arable land79%Water bodies4%Others9%Forest reserves1% Table I (a) shows that, more than 3/4 of the DISTRICT land is arable land, while in table I (b) indicates that CHUNYA DISTRICT is the largest DISTRICT in Mbeya region compared to other districts. Table I: (b) DISTRICTS OF MBEYA REGION AND THEIR AREA DISTRICT Area in Regional share (%) CHUNYA Mbeya Urban Kyela Ileje Rungwe Mbozi Mbeya Rural 29,219 185 1,322 1,908 2,211 9,679 19,098 Total 63,622 4 Source: Mbeya Regional Socio - Economic PROFILE .
10 Chart 2: Distribution of Land use in Mbeya Region by DISTRICT CHUNYA Urb .3%Kyela 3%Rungwe Rur 30% ADMINISTRATIVE UNITS Administratively, CHUNYA DISTRICT is divided into four (4) divisions namely: Kiwanja, Kipembawe, Kwimba and Songwe. The four divisions are sub - divided into 22 wards in total, and the wards are further sub-divided into 69 villages, as Table II below depicts. Table II (a): LAND AREA AND ADMINISTRATIVE UNITS Divisions Land area Number of Wards Number of Villages 5 Kiwanja Kipembawe Kwimba Songwe 4,383 8,766 10,226 5,844 6 6 5 5 19 15 14 21 Total 29,219 22 69 Source: CHUNYA DISTRICT Council.