Transcription of Cluster Validation - Kent
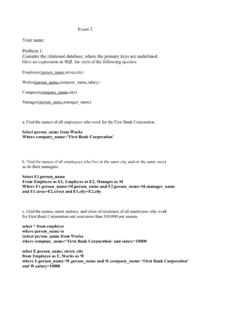
1 Cluster ValidationCluster Validity For supervised classification we have a variety of measures to evaluate how good our model is Accuracy, precision, recall For Cluster analysis, the analogous question is how to evaluate the goodness of the resulting clusters? But clusters are in the eye of the beholder ! Then why do we want to evaluate them? To avoid finding patterns in noise To compare clustering algorithms To compare two sets of clusters To compare two clustersClusters found in Random Data00 . 20 . 40 . 60 . 8100 . 10 . 20 . 30 . 40 . 50 . 60 . 70 . 80 . 91xyRandom Points00.
2 20 . 40 . 60 . 8100 . 10 . 20 . 30 . 40 . 50 . 60 . 70 . 80 . 91xyK-means00 . 20 . 40 . 60 . 8100 . 10 . 20 . 30 . 40 . 50 . 60 . 70 . 80 . 91xyDBSCAN00 . 20 . 40 . 60 . 8100 . 10 . 20 . 30 . 40 . 50 . 60 . 70 . 80 . 91xyComplete the clustering tendency of a set of data, , distinguishing whether non-random structure actually exists in the data. the results of a Cluster analysis to externally known results, , to externally given class how well the results of a Cluster analysis fit the data without reference to external information. - Use only the the results of two different sets of Cluster analyses to determine which is the correct number of 2, 3, and 4, we can further distinguish whether we want to evaluate the entire clustering or just individual clusters.
3 Different Aspects of Cluster Validation Numerical measures that are applied to judge various aspects of Cluster validity, are classified into the following three types. External Index: Used to measure the extent to which Cluster labels match externally supplied class labels. Entropy Internal Index: Used to measure the goodness of a clustering structure without respect to external information. Sum of Squared Error (SSE) Relative Index: Used to compare two different clusterings or clusters. Often an external or internal index is used for this function, , SSE or entropy Sometimes these are referred to as criteria instead of indices However.
4 Sometimes criterion is the general strategy and index is the numerical measure that implements the of Cluster Validity Two matrices Proximity Matrix Incidence Matrix One row and one column for each data point An entry is 1 if the associated pair of points belong to the same Cluster An entry is 0 if the associated pair of points belongs to different clusters Compute the correlation between the two matrices Since the matrices are symmetric, only the correlation between n(n-1) / 2 entries needs to be calculated. High correlation indicates that points that belong to the same Cluster are close to each other.
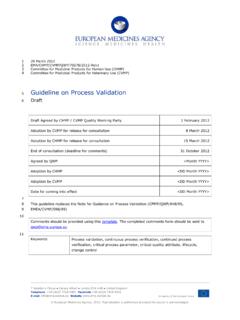
5 Not a good measure for some density or contiguity based Cluster Validity Via CorrelationMeasuring Cluster Validity Via Correlation Correlation of incidence and proximity matrices for the K-means clusterings of the following two data sets. 00 . 20 . 40 . 60 . 8100 . 10 . 20 . 30 . 40 . 50 . 60 . 70 . 80 . 91xy00 . 20 . 40 . 60 . 8100 . 10 . 20 . 30 . 40 . 50 . 60 . 70 . 80 . 91xyCorr = = Order the similarity matrix with respect to Cluster labels and inspect visually. Using Similarity Matrix for Cluster Validation00 . 20 . 40 . 60 . 8100 . 10 . 20 . 30 . 40 . 50.
6 60 . 70 . 80 . 91xyP o i n t sPoints2 04 06 08 01 0 01 02 03 04 05 06 07 08 09 01 0 0S i mi la r i t y00 . 10 . 20 . 30 . 40 . 50 . 60 . 70 . 80 . 91 Using Similarity Matrix for Cluster Validation Clusters in random data are not so crispP o i n t sPoints2 04 06 08 01 0 01 02 03 04 05 06 07 08 09 01 0 0S i mi la r i t y00 . 10 . 20 . 30 . 40 . 50 . 60 . 70 . 80 . 91 DBSCAN00 . 20 . 40 . 60 . 8100 . 10 . 20 . 30 . 40 . 50 . 60 . 70 . 80 . 91xyP o i n t sPoints2 04 06 08 01 0 01 02 03 04 05 06 07 08 09 01 0 0S i mi la r i t y00 . 10 . 20 . 30 . 40 . 50 . 60 . 70 . 80.
7 91 Using Similarity Matrix for Cluster Validation Clusters in random data are not so crispK-means00 . 20 . 40 . 60 . 8100 . 10 . 20 . 30 . 40 . 50 . 60 . 70 . 80 . 91xyUsing Similarity Matrix for Cluster Validation Clusters in random data are not so crisp00 . 20 . 40 . 60 . 8100 . 10 . 20 . 30 . 40 . 50 . 60 . 70 . 80 . 91xyP o i n t sPoints2 04 06 08 01 0 01 02 03 04 05 06 07 08 09 01 0 0S i mi la r i t y00 . 10 . 20 . 30 . 40 . 50 . 60 . 70 . 80 . 91 Complete LinkUsing Similarity Matrix for Cluster Validation1 235647 DBSCAN00 . 10 . 20 . 30 . 40 . 50 . 60 . 70.
8 80 . 915 0 01 0 0 01 5 0 02 0 0 02 5 0 03 0 0 05 0 01 0 0 01 5 0 02 0 0 02 5 0 03 0 0 0 Clusters in more complicated figures aren t well separated Internal Index: Used to measure the goodness of a clustering structure without respect to external information SSE SSE is good for comparing two clusterings or two clusters (average SSE). Can also be used to estimate the number of clustersInternal Measures: SSE2 5 1 01 52 02 53 001234567891 0 KSSE51 01 5- 6- 4- 20246 Internal Measures: SSE SSE curve for a more complicated data set1 235647 SSE of clusters found using K-means Need a framework to interpret any measure.
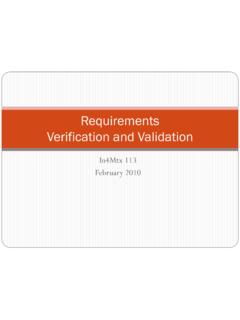
9 For example, if our measure of evaluation has the value, 10, is that good, fair, or poor? Statistics provide a framework for Cluster validity The more atypical a clustering result is, the more likely it represents valid structure in the data Can compare the values of an index that result from random data or clusterings to those of a clustering result. If the value of the index is unlikely, then the Cluster results are valid These approaches are more complicated and harder to understand. For comparing the results of two different sets of Cluster analyses, a framework is less necessary.
10 However, there is the question of whether the difference between two index values is significantFramework for Cluster Validity Example Compare SSE of against three clusters in random data Histogram shows SSE of three clusters in 500 sets of random data points of size 100 distributed over the range for x and y valuesStatistical Framework for SSE0 . 0 1 60 . 0 1 80 . 0 20 . 0 2 20 . 0 2 40 . 0 2 60 . 0 2 80 . 0 30 . 0 3 20 . 0 3 4051 01 52 02 53 03 54 04 55 0S SECount00 . 20 . 40 . 60 . 8100 . 10 . 20 . 30 . 40 . 50 . 60 . 70 . 80 . 91xy Correlation of incidence and proximity matrices for the K-means clusterings of the following two data sets.