Transcription of Commodity Price Monitor - RBC
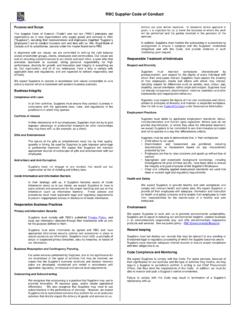
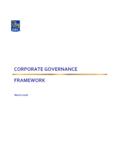
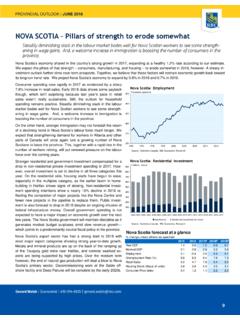
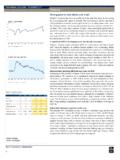
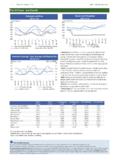
1 Commodity Price Monitor | JULY 2018 Commodity Price Monitor | June 2018. RBC Commodity Price index Commodity Price Monitor . January 1994 = 100 August 17, 2018. 400. 350 Commodity Price index fell in July 300 The RBC Commodity Price index fell in July matching June's decline. The July decline was due to widespread weakness across sub-indices. The 250. forest products sub-index fell and provided the greatest downward pres- 200 sure on the overall index. Despite the monthly weakness, the overall index 150 was higher than a year earlier. Similarly, the index ex-energy fell in July but stood higher than a year ago. 100. 2008 2009 2010 2011 2012 2013 2014 2015 2016 2017 2018. The energy products sub-index rose in July to completely reverse Monthly average Source: RBC Economics Research June's drop. Supply side disruption risks were likely partially re- sponsible for higher crude oil prices in Despite hotter-than-normal Index excluding energy product prices July weather, natural gas prices fell The energy products sub-index January 1994 = 100.
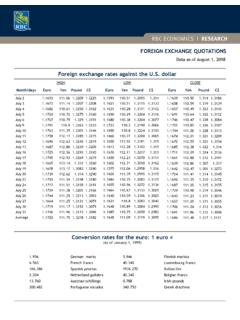
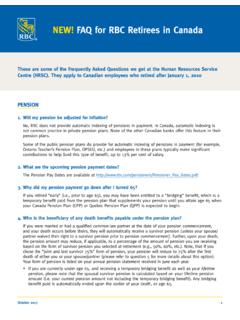
2 240. was higher than a year earlier. 210 The agricultural products sub-index fell in July. Japan and South Korea resumed wheat imports from Canada after June's temporary suspen- 180 sion. The end of the suspension was announced in late July. Wheat prices dropped in the month after falling in June. Compared to a year- 150 ago the agriculture products sub-index was down 120. 2008 2009 2010 2011 2012 2013 2014 2015 2016 2017 2018 The forest products sub-index dropped in July adding to the Monthly average dip in June. This is the first time in a year that the index has fallen for two Source: RBC Economics Research consecutive months. Lumber prices fell in July marking the largest single monthly decline in over two years. Despite the monthly drop, lum- Energy products sub-index ber prices were still 82% higher than in January 2017. Pulp and newsprint January 1994 = 100. 700. prices also fell in July though pulp prices remained at near record levels.
3 600. The non-precious metals & minerals sub-index fell in July on 500. widespread declines across its sub-components. Aluminum and iron ore 400 prices declined and respectively. 300. 200. The precious metals sub-index fell in July. Despite clear risks in markets, gold prices were pushed lower due to a combination of Fed 100. 2008 2009 2010 2011 2012 2013 2014 2015 2016 2017 2018 tightening in June and dollar Gold prices were nearly 100$/. Monthly average ounce lower in July then at the start of 2018. Source: RBC Economics Research RBC's Commodity Price index is a Fisher chain-weighted index of spot or transaction prices of 24 of the top export- ed Canadian-produced commodities. The weight of each Commodity in the overall index and various sub-indices is determined by its share of exports and is updated annually in February. Joseph Allegritti Research Associate | 416-974-5845 | Commodity Price . Commodity Price Monitor . Monitor | JULY.
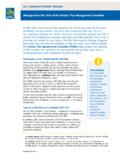
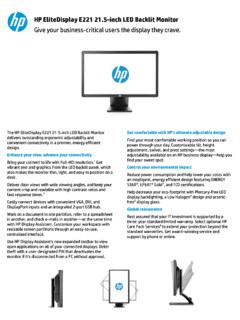
4 | June 20182018. RBC Commodity Price sub-indices Agricultural products sub-index Forest products sub-index January 1994 = 100 January 1994 = 100. 225 230. 210. 200. 190. 170. 175. 150. 150 130. 110. 125. 90. 100 70. 2008 2009 2010 2011 2012 2013 2014 2015 2016 2017 2018 2008 2009 2010 2011 2012 2013 2014 2015 2016 2017 2018. Monthly average Monthly average Source: RBC Economics Research Source: RBC Economics Research Non-precious metals & minerals sub-index Precious metals sub-index January 1994 = 100 January 1994 = 100. 400 500. 350. 400. 300. 250 300. 200. 200. 150. 100 100. 2008 2009 2010 2011 2012 2013 2014 2015 2016 2017 2018 2008 2009 2010 2011 2012 2013 2014 2015 2016 2017 2018. Monthly average Monthly average Source: RBC Economics Research Source: RBC Economics Research Period averages 2015 2016 2017 Q4-17 Q1-18 Q2-18 May-18 Jun-18 Jul-18. Indices RBC Commodity Price index Month-over-month/quarter-over-quarter % change Year-over-year % change RBC Commodity Price index ex.
5 Energy Month-over-month/quarter-over-quarter % change Year-over-year % change Sub-indices Agricultural products Month-over-month/quarter-over-quarter % change Year-over-year % change Energy products Month-over-month/quarter-over-quarter % change Year-over-year % change Forest products Month-over-month/quarter-over-quarter % change Year-over-year % change Non-precious metals & minerals Month-over-month/quarter-over-quarter % change Year-over-year % change Precious metals Month-over-month/quarter-over-quarter % change Year-over-year % change 2. Commodity Price Monitor | JULY 2018 Commodity Price Monitor | June 2018. Commodity prices trends Agricultural products Barley Canola US$ per tonne US$ per tonne 350 700. 300. 600. 250. 500. 200. 400. 150. 300. 100. 50 200. 2008 2009 2010 2011 2012 2013 2014 2015 2016 2017 2018 2008 2009 2010 2011 2012 2013 2014 2015 2016 2017 2018. Monthly average 10-year average Monthly average 10-year average Source: Haver Analytics, RBC Economics Research Source: Haver Analytics, RBC Economics Research Corn Wheat US$ per tonne US$ per tonne 350 750.
6 300. 600. 250. 450. 200. 300. 150. 100 150. 2008 2009 2010 2011 2012 2013 2014 2015 2016 2017 2018 2008 2009 2010 2011 2012 2013 2014 2015 2016 2017 2018. Monthly average 10-year average Monthly average 10-year average Source: Haver Analytics, RBC Economics Research Source: Haver Analytics, RBC Economics Research Potatoes Live cattle US$ per 100. US$ per 100 pounds 190. 16. 170. 14. 150. 12. 130. 10. 110. 8. 90. 6 70. 2008 2009 2010 2011 2012 2013 2014 2015 2016 2017 2018 2008 2009 2010 2011 2012 2013 2014 2015 2016 2017 2018. Monthly average 10-year average Monthly average 10-year average Source: Haver Analytics, RBC Economics Research Source: Haver Analytics, RBC Economics Research Live hogs Fresh salmon US$ per 100 US$ per kilogram 105 95 85 75 65 55 45 35 2008 2009 2010 2011 2012 2013 2014 2015 2016 2017 2018 2008 2009 2010 2011 2012 2013 2014 2015 2016 2017 2018. Monthly average 10-year average Monthly average 10-year average Source: Haver Analytics, RBC Economics Research Source: Haver Analytics, RBC Economics Research 3.
7 Commodity Price . Commodity Price Monitor . Monitor | JULY. | June 20182018. Commodity Price trends Energy products Forest products Coal Lumber US$ per tonne US$ per 1,000 board feet 200 750. 650. 160. 550. 120 450. 350. 80. 250. 40 150. 2008 2009 2010 2011 2012 2013 2014 2015 2016 2017 2018 2008 2009 2010 2011 2012 2013 2014 2015 2016 2017 2018. Monthly average 10-year average Monthly average 10-year average Source: Haver Analytics, RBC Economics Research Source: Haver Analytics, RBC Economics Research Crude oil (WTI) Newsprint US$ per barrel US$ per tonne 150 800. 120 700. 90 600. 60 500. 30 400. 2008 2009 2010 2011 2012 2013 2014 2015 2016 2017 2018 2008 2009 2010 2011 2012 2013 2014 2015 2016 2017 2018. Monthly average 10-year average Monthly average 10-year average Source: Haver Analytics, RBC Economics Research Source: Bloomberg, RBC Economics Research Natural gas Pulp US$ per million British thermal units US$ per tonne 15 1400.
8 1300. 12. 1200. 9 1100. 1000. 6. 900. 800. 3. 700. 0 600. 2008 2009 2010 2011 2012 2013 2014 2015 2016 2017 2018 2008 2009 2010 2011 2012 2013 2014 2015 2016 2017 2018. Monthly average 10-year average Monthly average 10-year average Source: Haver Analytics, RBC Economics Research Source: Bloomberg, RBC Economics Research Precious metals Gold Silver US$ per troy ounce US$ per troy ounce 2000 45. 1700. 35. 1400. 25. 1100. 15. 800. 500 5. 2008 2009 2010 2011 2012 2013 2014 2015 2016 2017 2018 2008 2009 2010 2011 2012 2013 2014 2015 2016 2017 2018. Monthly average 10-year average Monthly average 10-year average Source: Haver Analytics, RBC Economics Research Source: Haver Analytics, RBC Economics Research 4. Commodity Price Monitor | JULY 2018 Commodity Price Monitor | June 2018. Commodity Price trends Non-precious metals & minerals Aluminum Copper US$ per pound US$ per pound 5. 4. 3. 2. 1. 2008 2009 2010 2011 2012 2013 2014 2015 2016 2017 2018 2008 2009 2010 2011 2012 2013 2014 2015 2016 2017 2018.
9 Monthly average 10-year average Monthly average 10-year average Source: Haver Analytics, RBC Economics Research Source: Haver Analytics, RBC Economics Research Iron ore Lead US$ per tonne US$ per pound 200 160. 120. 80. 40. 0 2008 2009 2010 2011 2012 2013 2014 2015 2016 2017 2018 2008 2009 2010 2011 2012 2013 2014 2015 2016 2017 2018. Monthly average 10-year average Monthly average 10-year average Source: Haver Analytics, RBC Economics Research Source: Haver Analytics, RBC Economics Research Nickel Potash US$ per pound US$ per tonne 20 900. 15 700. 10 500. 5 300. 0 100. 2008 2009 2010 2011 2012 2013 2014 2015 2016 2017 2018 2008 2009 2010 2011 2012 2013 2014 2015 2016 2017 2018. Monthly average 10-year average Monthly average 10-year average Source: Haver Analytics, RBC Economics Research Source: Haver Analytics, RBC Economics Research Uranium Zinc US$ per pound US$ per pound 100 80. 60. 40. 20. 0 2008 2009 2010 2011 2012 2013 2014 2015 2016 2017 2018 2008 2009 2010 2011 2012 2013 2014 2015 2016 2017 2018.
10 Monthly average 10-year average Monthly average 10-year average Source: Haver Analytics, RBC Economics Research Source: Haver Analytics, RBC Economics Research 5. Commodity Price . Commodity Price Monitor . Monitor | JULY. | June 20182018. Commodity Price trends Period averages 2015 2016 2017 Q4-17 Q1-18 Q2-18 May-18 Jun-18 Jul-18. Agricultural products Barley (US $/tonne) Year-over-year % change Canola (US $/tonne) Year-over-year % change Corn (US $/tonne) Year-over-year % change Wheat (US $/tonne) Year-over-year % change Potatoes (US $/cwt)* Year-over-year % change Live cattle (US $/cwt) Year-over-year % change Live hogs (US $/cwt) Year-over-year % change Fresh salmon (US $/kg)* Year-over-year % change Energy Coal (US $/tonne) Year-over-year % change Crude Oil (US $/barrel) Year-over-year % change Natural Gas (US $/mmbtu) Year-over-year % change Forest products Lumber (US $/1000 board ft) Year-over-year % change Newsprint (US $/tonne) Year-over-year % change Pulp (US $/tonne) Year-over-year % change Source: Haver Analytics, Bloomberg, RBC Economics Research; * latest potato & salmon Price based on percent change in BLS PPI index 6.