Transcription of Container Closure Integrity Testing (CCIT): a Risk ...
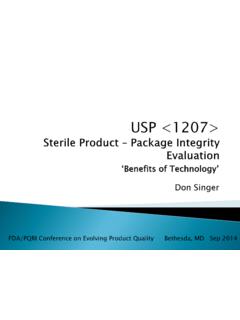
1 Marco Silvestri Andrea Simonetti Container Closure Integrity Testing (CCIT): a Risk Management Application Omron meets Pharma Milan, January 29th 2014 Process: Container Closure Integrity Testing for Blow-Fill-Seal In line equipment to test 100% of the production: downstream of a Blow-Fill-Seal machine for aseptic primary packaging providing a 60 Container Per Minute (CPM) output rate upstream of a secondary packaging machine Standard ASTM F-2338-09: Standard Test Method for Non-destructive detection of Leaks in Packages by Vacuum Decay FDA (CDRH) Recognised Consensus Standard Bonfiglioli Engineering Leak Testing machine Working principle: a)Vacuuming: the period of vacuum setting within the test chamber b)Stabilization: the time necessary to get a homogeneous vacuum distribution within the test chamber c) Testing : the time frame in which the vacuum level is monitored.
2 Two measurements are taken (First and second reading) Decision-making: THR Accepted > THR Rejected (Micro leakage) 1a < M_LEV Rejected (Gross leakage) t P State of Art: to find out proper statistical approach Project: to elaborate a model to relate data trends and failures Implementation & test: MATLAB Simulation oSimulated data with noise oReal data from the field Statistical Process Control Algorithm Industrialization: To increase process reliability To improve the equipment productivity To minimize forced downtime To quickly identify errors or anomalies causes Techniques.
3 Quality Risk Management (QRM) Process Analytical Technology (PAT) & Statistical Process Control (SPC) Six Sigma Definition and analysis Control Strategy Development Continuous Improvement Systematic approach to risk management General issues Impact Quality Business Decrease of process reliability High - Variability High - Performance drift - High Need for corrective actions - Med Extraordinary maintenance costs - Med Component wear - Low Continuous Data Process described by Gaussian curve Dispersion could vary in different ways: Mean Deviation Variance Deviation Shape Deviation 22121)( xexfCommon Causes Natural process dispersion Affect process capacity Always present in the system Predictable Special Causes Non predictable dispersion Affect process stability Intermittent Case studies show Most of the processes run off-control It s fundamental to identify the main cause of variation Targeted interventions improve the process Vision: PAT methodology could help?
4 Food and Drug Administration (FDA) references: o Guidance for industry: PAT A framework for innovative pharmaceutical development, manufacturing and quality assurance; September 2004 o Pharmaceutical cGMPs for the 21st century A risk based approach; Final Report, September 2004 Principles: Enhance understanding and control the manufacturing process Quality cannot be tested into products; it should be built-in or should be by design Transposition: PAT is intended for drug manufacturing The concept can be extended to other processes Tools: SPC: Control charts Six Sigma: DMAIC model Process Control Continuous Monitoring Produce High Quality Process Improvement Reduce Dispersion Manage Anomalies Process Analysis SPC: Stability SPC.
5 Capacity Process Assessment DoE Simulation Modeling Process Understanding CQA CPP Control Improve Analyse Measure Define PAT application in a DMAIC structure Risk management process SPCA uses DMAIC for Analysis, Improvement and Control Target: monitor and manage the process Stability: detection of special causes Capacity: estimating the effects of the common causes Assessment: Internal know-how Testing process decision-making CQA: Property to ensure the Quality of the Process Stability Reliability Repeatability CPP: Variables that affect CQA 1st Reading Delta Process Capability: measurable property of a process to the specification, expressed as a process capability index Cp: the ability of a process to potentially produce output within specification limits Cpk: the ability of a process to actually produce output within specification limits Standard.
6 ASTM E2281 Standard Practice for Process and Measurement Capability Indices Running a comprehensive and targeted set of faults Results analysis Identify the impact of mechanical, pneumatic, electrical and configuration anomalies during the period of activity Highlight the effect that each anomaly has on the CPP The presence of special causes determines a process drift Indicators deviation CPP ( Out Of Control OOC ) Altering test results Deterioration of the machine performances SPCA: Control charts OOC points Detection Sequence: actions elimination How to organize data Matrix N rows = Measurements number K columns = Measurements sets Sampling tradeoff N: oreactivity (detect rapid changes): se N orobustness (avoid false detections): se N K: oaccuracy of the regression: se K osampling time: se K oprompt response: se K K1 ID K2 ID Kx ID KN ID 1 (N+1) (x*N+1).
7 2 (N+2) .. N 2*N .. K*N Need for dynamic adaptation N = 10 R-Chart X-Chart Mean Deviation Variance Deviation Dispersion type Western Electric Rules (WER) Only the first four rules to minimize the risk of false alarms Score associated with each violation: : 1 or more points outside the control limits 3 ( Score S = 3 ) : 2 out of 3 consecutive points outside the warning limits 2 ( S = 1 ) : 4 out of 5 consecutive points outside the band ( S = 1 ) : 8 consecutive points on the same side of the centerline ( S = 1 ) The sum ( ) of all partial scores is compared with a threshold of acceptability ( WE_THR ): oIf ( > WE_THR) Process is Out of Control Method of least squares Confidence interval (CI) settable: 90%, 95%, 99%, , 99,7% Configuration Method: CI : possible false alarms CI : difficulty in detecting weak trend Trend: blue line on the Control Chart Test chamber contaminated.
8 Leakage from a defective BFS liquid evaporation decreases vacuum 1st reading (10 mbar decrease ) X-Chart detects OOC points ( 3, 4, 5, 6 ) Note: Automatic Drying System ADS If the M_LEV threshold is mistakenly set too low, the ADS is not activated Electrovalve failure: Switch time increases due to dust 1st reading slowly decrease( 5 mbar / 2880 test cycles ) Note: How many points are needed to detect this trend? If K=40 X-Chart detects trend K Start Chart Nr Trend R 20 100 16 - X 30 150 11 8 X 40 200 8 2, 3, 4, 5, 6, 7, 8 OK 50 250 6 2, 3, 4, 5, 6 OK Small seal defect: Tiny plastic particles compromise airtightness Quick decrease of 1st reading value ( 5 mbar / 480 test cycles greater slope) Note: If K=20 X-Chart detects trend K Start Chart Nr Trend R 10 50 9 - X 20 150 4 1,2,3,4 OK 30 200 3 1,2,3 OK 40 250 2 1,2 OK Severe damage of the seal: cut seal 1st reading value decreases dramatically Step Height (mbar) Result X X OK 1 OK SPCA.
9 Estimates the common causes impact provides feedback about the improvements to be made continuous process capability analysis is performed: oCPP values are taken as input o Cp and Cpk indicator values are returned as output Guidelines: Cp & Cpk Cp < OK verify the process is centered on the taget value by means of Cpk Cpk Cp OK Action to perform for process capability and equipment efficiency: Trade-off: performance / expected quality / cost to sustain From SPCA analysis over a wide range of operating cycle: configuration parameters adjustement hardware fine-tuning sub-systems: use of embedded diagnostic tools system: of test vacuum generation system routing and sizing regolators calibrations chamber: of materials sizing tolerances refinement of compensator springs on test chamber mobile bottom part shaft Requirements Process control and optimization.
10 System improvement Approach Cooperation between academia and internal R&D Verification Relevant operating conditions Results Continuous improvement Andrea Simonetti QA & Validation Manager Bonfiglioli Engineering Marco Silvestri BIOPHARMANET-TEC Interdepartmental Centre for Innovation in Health Products ISTePS - Institute of Systems and Technologies for Sustainable Production Questions & Comments