Transcription of CONTROL CHART - Air University
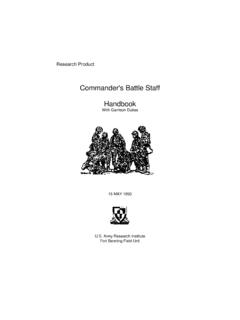
1 Basic Tools for process ImprovementCONTROL CHART1 Module 10 CONTROL CHARTB asic Tools for process Improvement2 CONTROL CHARTWhat is a CONTROL CHART ?A CONTROL CHART is a statistical tool used to distinguish between variation in a processresulting from common causes and variation resulting from special causes. Itpresents a graphic display of process stability or instability over time (Viewgraph 1).Every process has variation. Some variation may be the result of causes which arenot normally present in the process . This could be special cause variation. Somevariation is simply the result of numerous, ever-present differences in the process . This is common cause variation. CONTROL Charts differentiate between these twotypes of goal of using a CONTROL CHART is to achieve and maintain process stability.
2 process stability is defined as a state in which a process has displayed a certaindegree of consistency in the past and is expected to continue to do so in the future. This consistency is characterized by a stream of data falling within CONTROL limits based on plus or minus 3 standard deviations (3 sigma) of the centerline [ , p. 82]. We will discuss methods for calculating 3 sigma limits later in this module. NOTE: CONTROL limits represent the limits of variation that should be expected froma process in a state of statistical CONTROL . When a process is in statistical CONTROL , anyvariation is the result of common causes that effect the entire production in a similarway. CONTROL limits should not be confused with specification limits, whichrepresent the desired process should teams use CONTROL Charts?
3 A stable process is one that is consistent over time with respect to the center and thespread of the data. CONTROL Charts help you monitor the behavior of your process todetermine whether it is stable. Like Run Charts, they display data in the timesequence in which they occurred. However, CONTROL Charts are more efficientthat Run Charts in assessing and achieving process team will benefit from using a CONTROL CHART when you want to (Viewgraph 2)Monitor process variation over between special cause and common cause the effectiveness of changes to improve a how a process performed during a specific CHARTVIEWGRAPH 2 Why Use CONTROL Charts? Monitor process variation over time Differentiate between special cause andcommon cause variation Assess effectiveness of changes Communicate process performanceCONTROL CHARTVIEWGRAPH 1 What Is a CONTROL CHART ?
4 A statistical tool used to distinguishbetween process variation resultingfrom common causes and variationresulting from special Tools for process ImprovementCONTROL CHART3 Basic Tools for process Improvement4 CONTROL CHARTWhat are the types of CONTROL Charts?There are two main categories of CONTROL Charts, those that display attribute data,and those that display variables Data: This category of CONTROL CHART displays data that result fromcounting the number of occurrences or items in a single category of similaritems or occurrences. These count data may be expressed as pass/fail,yes/no, or presence/absence of a defect. Variables Data: This category of CONTROL CHART displays values resultingfrom the measurement of a continuous variable.
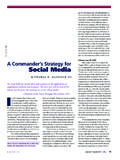
5 Examples of variables dataare elapsed time, temperature, and radiation these two categories encompass a number of different types of CONTROL Charts(Viewgraph 3), there are three types that will work for the majority of the data analysiscases you will encounter. In this module, we will study the construction andapplication in these three types of CONTROL Charts:X-Bar and R ChartIndividual X and Moving Range CHART for Variables DataIndividual X and Moving Range CHART for Attribute DataViewgraph 4 provides a decision tree to help you determine when to use these threetypes of CONTROL this module, we will study only the Individual X and Moving Range CONTROL Chartfor handling attribute data, although there are several others that could be used, suchas the np, p, c, and u charts.
6 These other charts require an understanding ofprobability distribution theory and specific CONTROL limit calculation formulas which willnot be covered here. To avoid the possibility of generating faulty results byimproperly using these charts, we recommend that you stick with the Individual X andMoving Range CHART for attribute following six types of charts will not be covered in this module:X-Bar and S ChartMedian X and R Chartc Chartu Chartp Chartnp ChartCONTROL CHARTVIEWGRAPH 3 What Are the CONTROL CHART Types? CHART types studied in this module:X-Bar and R ChartIndividual X and Moving Range CHART - For Variables Data - For Attribute DataOther CONTROL CHART types:X-Bar and S CHART u ChartMedian X and R CHART p Chartc CHART np ChartCONTROL CHARTVIEWGRAPH 4 CONTROL CHART Decision TreeAre youchartingattributedata?
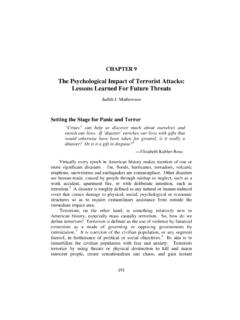
7 YESNOYESNOData arevariablesdataIs samplesizeequal to1?Use XmRchart forvariablesdataFor sample sizebetween 2 and15, use X-Barand R ChartUse XmRchart forattributedataBasic Tools for process ImprovementCONTROL CHART5 Basic Tools for process Improvement6 CONTROL CHARTWhat are the elements of a CONTROL CHART ?Each CONTROL CHART actually consists of two graphs, an upper and a lower, whichare described below under plotting areas. A CONTROL CHART is made up of eightelements. The first three are identified in Viewgraphs 5; the other five in The title briefly describes the information which is This is information on how and when the data were Collection Section. The counts or measurements are recorded in thedata collection section of the CONTROL CHART prior to being graphed.
8 Areas. A CONTROL CHART has two areas an upper graph and a lowergraph where the data is upper graph plots either the individual values, in the case of anIndividual X and Moving Range CHART , or the average (mean value) of thesample or subgroup in the case of an X-Bar and R lower graph plots the moving range for Individual X and MovingRange charts, or the range of values found in the subgroups for X-Bar andR or Y-Axis. This axis reflects the magnitude of the data collected. The Y-axis shows the scale of the measurement for variables data, or thecount (frequency) or percentage of occurrence of an event for or X-Axis. This axis displays the chronological order in which thedata were Limits. CONTROL limits are set at a distance of 3 sigma above and 3sigma below the centerline [Ref.]
9 6, pp. 60-61]. They indicate variation fromthe centerline and are calculated by using the actual values plotted on theControl CHART This line is drawn at the average or mean value of all the plotteddata. The upper and lower graphs each have a separate CHARTVIEWGRAPH 5 elements of a CONTROL ChartMEASUREMENTSDateTitle: _____ Legend:_____AverageRange1234561234567891 011121314213 CONTROL CHARTVIEWGRAPH 6 elements of a CONTROL Tools for process ImprovementCONTROL :xTheaverageofthemeasurementswithineachs ubgroupxiTheindividualmeasurementswithin asubgroupnThenumberofmeasurementswithina subgroupSubgroup 1 2 3 4 5 6 7 8 9 = 5= + + + + 5
10 X = Basic Tools for process Improvement8 CONTROL CHARTWhat are the steps for calculating and plotting anX-Bar and R CONTROL CHART for Variables Data?The X-Bar (arithmetic mean) and R (range) CONTROL CHART is used with variablesdata when subgroup or sample size is between 2 and 15. The steps forconstructing this type of CONTROL CHART are: Step 1 - Determine the data to be collected. Decide what questions about the process you plan to answer. Refer to the Data Collection module for informationon how this is 2 - Collect and enter the data by subgroup. A subgroup is made up ofvariables data that represent a characteristic of a product produced by a process . The sample size relates to how large the subgroups are. Enter the individualsubgroup measurements in time sequence in the portion of the data collectionsection of the CONTROL CHART labeled MEASUREMENTS (Viewgraph 7).