Transcription of Control loop performance assessment using ordinal time ...
1 17th European Symposium on Computer Aided Process Engineering ESCAPE17 V. Plesu and Agachi (Editors) 2007 Elsevier All rights reserved. 1 Control loop performance assessment using ordinal time series analysis Ernesto Mart neza, C sar de Pradab aCONICET/UTN, Avellaneda 3657, Santa Fe 3000, Argentina, bUNIVERSIDAD DE VALLADOLID, 47011 Valladolid, Spain, Abstract Both safety and economy of process plants are heavily dependent on the proper functioning of several thousand Control loops regulating or optimizing unit and plant-wide performance over a wide range of operating conditions. In this work ordinal methods for analyzing controller s error are proposed by focussing on merely comparing error values beyond a proper Control horizon.
2 The local order structure of a well-performing controller is characterized as a symbolic sequence of equally probable permutations. A new performance index based on the complexity of the error time series measured by the permutation entropy of ordinal patterns is proposed. Keywords: Complexity, Control loop monitoring ordinal analysis, ordinal patterns, Permutation entropy, Process Control ; Time series . 1. Introduction Control loops implementing a hierarchy of functions for process regulation and optimization are the cornerstone of safety and economy in process plants [1]. Many loops are just PID controllers whilst other may be more advanced ones, such as inferential loops , MPCs and real-time optimizers working on top of the regulation layer.
3 It is well known that in most industrial environments the behavior of Control loops deteriorate with time due to a number of reasons, fouling, utility constraints and raw material variability. Accordingly, process dynamic characteristics change along time and, if not properly maintained, most 2 E. Mart nez et al. Control loops will perform poorly after some time, which can lead to degraded process operation. In particular, problems with the regulation layer can cancel the benefits of advanced Control systems and real-time optimization [2]. With the increasing complexity of Control structures and the sheer number of controllers in modern process plants, the automation of performance monitoring tasks is mandatory [2,3].
4 In this work, the concept of predictability patterns in the error time series proposed in [4] is put in the framework of ordinal methods. 2. ordinal methods Error order patterns If a Control loop exhibits good performance , it should be able to cancel any disturbance entering the loop up to a present time t, or follow a set point change correctly, after some sensible time interval b (expressed in terms of sampling periods), so-called Control horizon which is roughly equal to the loop settling time. Then, it can be said that, from t + b onwards the error time series cannot be distinguished from a random walk stochastic process. This fact strongly suggest that for monitoring the vital information in the error time series is primary local.
5 However, due to the occurrence of noise and unknwon disturbances in various forms, it is far from trivial to get reliable information about a Control system performance directly from its error time series. Moreover, the statistical assumption of normal distribution error is unsound and misleading. To overcome these problems and gain insight into the local structure this work based performance analyisis only in ordinal relationships between error values instead of values themselves. Given the error time series (e1, e2,.., eT) it is of interest to study the order patterns for n equally spaced time points t, t+b, t+2b,.., t+(n-1)b, where t runs from 1 to T-(n-1)b. The concept is graphically explained in using a fictitious error series.
6 By the ordinal pattern of order n at time t it is understood the permutation of ranks )(tbn = (r0, r1,.., rn) of (1, 2, .., n) satisfying: brtbrtbrtbrtnnoeeee (1) For a given n there are n! possible order patterns or permutations. In Fig. 2, the six order patterns for n=3 are shown. These permutations can be easily assigned to the numbers 1, .. , n! If the controller is working properly the probability of any of these permutations should be identical and the superimposed stochastic process should follow a random walk. However, if the controller is performing poorly, some of the permutations will become more frequent than others. The proposed approach is Control loop performance assessment using ordinal time series analysis 3 to take the frequencies of order patterns in a data set as an indication of the loop condition.
7 To account for the different pattern frequencies, we do not just take the number of s. We determine the entropy of the error time series [5]. Fig. 1. Superimposed random-walk stochastic process in the error time series Fig. 2. The six possible permutations for n=3. Permutation entropy For a permutation identified with number , let f( ) denote its frequency in the error time series [6]. In other words: f( ) is the number of t between 1 and T-(n-1)b for which t = . The relative frequency is p( ) = f( )/(T-(n-1)b). The local permutation entropy of order n for the time series is then defined as: = =!1)(log).(nnppH (2) Clearly, the permutation entropy characterizes the local order structure of the controller error.
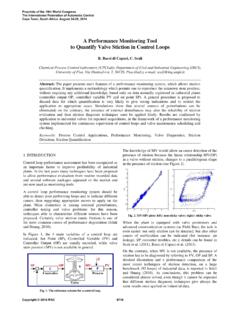
8 This is the information contained in comparing n consecutive values in the time series. Typically n is chosen between 3 and 7. The smallest 4 E. Mart nez et al. possible value of Hn is zero. It will be attained for a monotonously increasing or decreasing series which can be easily predicted. The largest possible value of Hn is log n! which is realized when all permutations have equal probability. This is the limit value for a controller which is perfectly working over the Control horizon b (here we refer to natural logarithms, but it does not matter which log we take). Example Consider a small part of a error time series for a flow controller consisting of 72 data points (see Fig. 3). For t = 72; b= 12 and n = 6, the ordinal relationships are as follows: e12 > e60 > e48 > e24 > e1 > e72 > e60.
9 Hence, for this particular t the resulting permutation (t)=(1, 5, 4, 2, 0, 6, 3) yielding a qualitative reconstruction of the up-and-downs which may be readily associated with a well performing controller. However, it is worth remembering that all 6!=720 possible permutations are all equally probable as t is varied between 1 and T-(n-1)b, assuming the value of b is right and T is large enough. It is worth emphasizing that if the loop is performing well, controller errors separated by a least b time steps should approximate as a random walk stochastic process. To calculate the permutation entropy it is necesario to use a larger error series ( 1000 data points) and determine each (t) frequency in the data set. Fig.
10 3. ordinal pattern descriptive of local error 3. performance monitoring performance index For loop monitoring, the following performance index is proposed: Control loop performance assessment using ordinal time series analysis 5 6 5 ,4 ,3 ,!log==nnHnn (3) for a controller working properly this performance index should be very close to 1. As any of the permutations in Fig. 2 increases its probability over 1/n!, the value of n will exhibit a decrease which is indicative of degraded performance . Choosing a low value of n such as 3 o 4 it is the best option for a number of reasons. Firstly, if the Control horizon b is properly set, the type of information for loop monitoring the permutation entropy can provide is independent of n.