Transcription of Correlation and Linear Regression - Canada
1 131 LEARNING OBJECTIVES Analyze a scatterplot to identify pos-sible relationships in bivariate data Calculate and interpret a Correlation coeffi cient Compute and interpret a Linear Regression equation Use a Linear Regression equation for prediction Calculate and interpret R-squared Compute and interpret residuals Distinguish between Correlation and causation CONNECTIONS: CHAPTER In Chapter 5 we learned how to display and describe quantitative data, one variable at a time. In this chapter we learn how to display and assess the relationship between two quantitative variables. This is so important a topic that not only does it have a special name, but it will also be revisited later in the text ( Chapter 14 ). Linear Regression is the counterpart to the contingency tables in Chapter 4 . You can think of the three Chapters 4 , 5 , and 6 as a set that cover descriptive statistics for categorical and quantitative data, with one variable or two variables.
2 Correlation and Linear Regression RONA RONA, Inc., Canada s largest retailer of hardware, home renovation, and gardening products, began in 1939, when hardware store operators in Quebec formed a cooperative called Les Marchards en Quincailleries Ltee. to circumvent a monopoly in the hardware supply business. It survived the rise of department store chains through the 1940s and 1950s, and in 1960 a sister company, Quincaillerie Ro-Na Inc., was established. According to popular legend, the name came from the first two letters of the first names of Rolland Dansereau and Napoleon Piotte, the company s first presidents. Other regional hardware cooperatives sprang up in Canada , but Ro-Na remained inside Quebec. In the 1980s Ro-Na made purchases and alliances, acquiring gardening, interior decorating, and building materials stores, and brought them under one roof as a big-box retailer. Ro-Na and Home Hardware (in Western Canada ) formed Alliance RONA Home Inc.
3 Major changes were also taking place in the hardware industry, with the rise of Home Depot. The fierce competition between Home Depot and Canadian rivals began in Ontario but only spread to Quebec in 1998. While Ro-Na s sister company, Home Hardware, continued with small and medium-sized stores, other Canadian chains, such as 6 CHAPTER Niar/Shutterstock 1319/18/14 6:24 PMSurrey, British Columbia-based Revy Home Centres, Inc., did big-box battle with Home Depot in suburban Toronto. Ro-Na rolled out its own big-box stores (calling them large surface stores), but hoped to distinguish them from the competition with great customer service. During Canada s booming economy in the 1990s home improvement was a flourishing business. Each of the several large Canadian chains needed a strategy to keep market share. Ro-Na chose acquisition. In 1998, the company changed its name to RONA, Inc., opened new stores, and made its first foray into Ontario.
4 By 1999, RONA had almost 500 stores under various banners in eastern Canada , and sales rose to $ billion. RONA gained a coast-to-coast presence in the 2000s and equalled or surpassed Home Depot in market share, while making sure its stores were noticeably different from the American competitor. RONA, Inc. debuted on the Toronto Stock Exchange in October 2002. The company was now a public corporation, and no longer a cooperative. While RONA and Home Depot were the two biggest contenders in the Canadian hardware market, half the market was still shared by small independent hardware stores, along with the Home Hardware cooperative and Canadian Tire. RONA s strategy was to have stores in every segment of the market. It would continue to open large-surface stores as well as small neighbourhood stores. It attached RONA to the name of all of its stores. RONA wanted to take the warehouse out of the warehouse concept. Instead, its stores would offer an enticing shopping experience explained as Disney meets home improvement.
5 RONA used ideas from other successful chains. And the company strove to please women, who made the majority of home improvement buying decisions. But recent years have also been difficult. A slow recovery following the 2008 world economic crisis, lower consumer confidence, and a slowdown in the housing market have all had a major effect on RONA s growth. The first half of 2011 was a particularly difficult period in the Canadian renovation and construction industry. And in 2012, RONA fended off an unsolicited takeover bid by Lowe s. Currently, RONA has over 800 corporate, franchise, and affiliate retail stores of all sizes, formats, and banners, as well as 14 distribution centres. RONA employed nearly 30 000 people and had sales of $ billion in 2012. Competition in the sector remains fierce. With new management, store formats, smaller stores, new sales approaches, and a new corporate strategy, the leading company in home renovation is now undergoing its own corporate renovation.
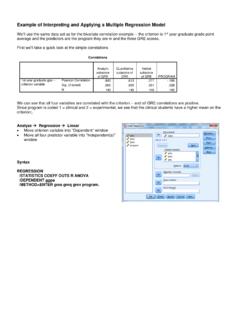
6 132 Based on information from 1329/18/14 6:24 PMRona 133 RONA s quarterly sales results fluctuate widely because of the highly seasonal nature of renovation and construction activities. Over 80% of RONA s net annual earnings come from the second and third quarters. Sales in the first quarter are always lowest due to low activity in renova-tion and construction during the winter. Even in the summer and fall, poor weather has a major impact on sales. RONA sells to both contractors and homeowners. Perhaps knowing how much Canadians spend on home renovation nationally can help predict RONA s sales. Here s a plot showing RONA s quarterly sales against Statistics Canada s quarterly data on spending for residential renovations. 1 14 00012 00010 000 Renovation Investment ($M)800060004000004006008001000 Sales ($M)120014001600 Figure RONA s Sales ($M) and residential Renovation Investment , quarterly, 2002 2012.
7 If you were asked to summarize this relationship, what would you say? Clearly RONA s sales grew when home renovation spending grew. This plot is an example of a scatterplot , which plots one quantitative variable against another. Just by looking at a scatterplot, you can see patterns, trends, relationships, and even the occasional unusual values standing apart from the others. Scatterplots are the best way to start observing the relationship between two quantitative variables. Relationships between variables are often at the heart of what we d like to learn from data. Is consumer confidence related to oil prices? What happens to customer satisfaction as sales increase? Is an increase in money spent on advertising related to sales? What is the relationship between a stock s sales volume and its price? Questions such as these relate two quantitative variables and ask whether there is an association between them.
8 Scatterplots are the ideal way to picture such associations. Why is this topic the most logical one to follow Chapters 4 and 5 ? Chapter 4 began with graphs and numerical summaries of categorical data, one variable at a time (the formal term is univariate ). Then it moved on to contingency tables to examine the association between two categorical variables (called bivariate analy-sis). Similarly, Chapter 5 discussed univariate graphs and numerical summaries of quantitative data, one variable at a time, but stopped short of bivariate descriptive statistics; so there is no analogue to contingency tables. That is the role of scatter-plots and Correlation and that is why Chapter 6 comes next! WHO Quarter years of financial data WHAT RONA s Sales and Canadian expenditures on residential Renovations UNITS Both in $M WHEN 2002 2012 WHERE Canada WHY To assess RONA s sales relative to the home renova-tion market 1 Table 026 0013 Residential values, by type of invest-ment quarterly scatterplot, which plots one quantitative variable against another.
9 There is an association between them. Questions such as these relate two quantitative variables and ask 1339/18/14 6:24 PM134 CHAPTER 6 Correlation and Linear Regression Looking at Scatterplots The value of the Canadian dollar affects Canadians in a multitude of ways from pricing of foreign-made products to travel costs to investment returns. For Canadian manufacturers selling products in the United States, a more valuable Canadian dollar can significantly reduce profitability. For example, if the CAD:USD exchange rate is :1, a $5 USD sale is worth $6 CAD. If the Canadian dollar increases in value to parity (1:1), a $5 USD purchase is now worth only $5 CAD to the manufacturer. This has caused many to argue that the higher Canadian dollar is damaging the Canadian manufacturing sector. One major driver of the value of the Canadian dollar is oil. Oil from the Alberta oil sands makes up a significant portion of the Canada s total exports.
10 To buy Canadian oil, foreign buyers need to purchase Canadian dollars with foreign WHO Years of financial data WHAT Official Exchange Rate and inflation-adjusted Price per Barrel of oil UNITS Exchange Rate (Canadian $ rela-tive to US $); Price per Barrel (US $) WHEN 1980 2011 WHERE Canada WHY To examine the relationship between exchange rate and price per barrel of oil per Barrel ($US) Rate (USD:CAD) Figure Official Exchange Rate (Canadian dollar relative to the dollar; Source: World Bank) vs. Inflation Adjusted Price Per Barrel of Oil (in dollars; Source: Bureau of Labor Statistics) for the period 1980 2011. currencies. An increase in the world price of oil increases total exports, subsequently increasing demand for Canadian dollars, driving up the value. To measure the effect of oil prices, we have gathered historical financial data on both oil prices and the value of the Canadian dollar.