Transcription of Cost and Price Metrics for Automotive Lithium-Ion Batteries
1 Cost and Price Metrics for Automotive Lithium-Ion Batteries Values of current energy technology costs and prices, available from a variety of sources, Metrics discussed in this fact sheet can sometimes vary. While some of this variation can be due to differences in the specific materials or configurations assumed, it can also reflect differences in the definition and Market Price context of the terms cost and Price . This fact sheet illustrates and explains this latter The selling prices for commercially source of variation in a case study of Automotive Lithium-Ion Batteries . available technology Reported measures of Automotive battery costs and prices vary widely. This is in part Modeled Price because the technology is relatively new and the shape, size, chemistry and packaging Estimate of manufacturers' minimum used for different vehicles However, variation is also introduced because important sustainable Price for commercially contextual information around the reported values is often not clearly stated, inviting available technology potentially unsuitable comparison of values from multiple sources.
2 As a simple example, Modeled Cost the Price a buyer pays for a battery can be referred to as a battery cost ( , cost to the Estimate of manufacturers' cost of buyer), while the cost a manufacturer incurs to produce that battery a distinct concept . production of commercially available can also be referred to as a battery cost. Further, technology research and development technology organizations may also define costs and cost targets in specific terms that suit their particular purposes. These definitions can produce values that differ from a commercial Lab Achieved Cost The projected cost of future high-volume pack production of near- commercial 1. The roughly 80,000 light-duty electric vehicles (battery electric vehicles and plug-in hybrid electric vehicles) sold in the United technologies currently in the Vehicle States in 2015 comprised 13 models, each with a unique design.
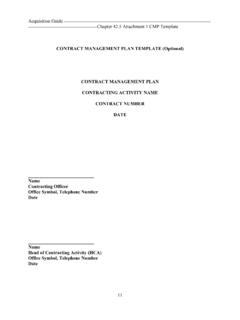
3 Tesla motors, often cited as a leader in low-cost Automotive batter- ies, currently uses small cylindrical cells, which are typically used in consumer electronics applications. Other auto manufacturers Technologies Office's (VTO's) research have chosen to focus on larger prismatic cells developed specifically for Automotive applications, which may achieve higher energy and development portfolio density and lower costs compared to consumer cells. 700 Market Price Modeled Price Modeled Cost VTO Lab Achieved Cost $615 Pack 600 Cell $570. $538. 500 $495 $492. $477. 400 $399. $/kWh $367. 300 $342 $289. $316 $268. $282 $297. $276. 200 $234 $220. 100. 0. 2014 2015 2014 2015 2014 2015 2014 2015 2014 2015 2014 2015 2014 2015.
4 BNEF Total Battery Roland Berger CEMAC CEMAC BNEF VTO (Pack + Cell). Consulting BNEF = Bloomberg New Energy Finance; CEMAC = Clean Energy Manufacturing Analysis Center Figure 1. Estimated national prices and costs of light-duty plug-in hybrid electric vehicle cells and packs for 2014 and 2015 from several sources. Market prices are observed values. Modeled costs and prices are intended to benchmark the current cost and Price , respectively. While lab VTO achieved costs are reported in current year, they are projections of expected costs in 3 5 years for high-volume production. Sources: Anderman (2016); Attwood (2016); Behl (2015); Curry (2015); VTO (2016); VTO (2015). OFFICE OF STRATEGIC PROGRAMS. 2 OFFICE OF STRATEGIC PROGRAMS.
5 Buyer's cost or a manufacturer's cost Drivers of Market drivers, cost models can be used to of production. An additional point of estimate current manufacturing costs in Price Reductions confusion arises from the nature of the absence of publicly available infor- Some portions of the observed the technology Automotive Batteries mation (as in the Automotive Lithium-Ion 2014 2015 market Price reductions or packs are composed of multiple battery industry), and to analyze the reflect improvements in the technology subcomponents, chief among them being cost impacts of various technology and ongoing maturation of manufac- cells. Nontechnical media commonly changes and improvements. The Clean turing processes ( , manufacturing use all three terms interchangeably, Energy Manufacturing Analysis Center cost reductions).
6 Price reductions creating confusion when a Price or cost (CEMAC) and Bloomberg New Energy may also be driven in part by market is reported. Finally, pack and cell costs Finance (BNEF) have created manu- conditions including global manufac- and prices vary depending upon their facturing cost models via independent turing overcapacity, supply contract intended application ( , plug-in hybrid efforts aimed at benchmarking current structures, and strategic corporate versus full electric vehicle) due to differ- costs of production (Chung, Elgqvist, behavior. Overcapacity may lead to ences in design and performance. and Santhanagopalan 2016; Attwood supply-demand imbalances, driving 2016). CEMAC has extended its Figure 1 compares 2014 and 2015 Price manufacturers to reduce prices in an model to estimate Price ; however, the and cost values for light-duty plug-in attempt to support sales volume and CEMAC Price model considers process hybrid electric vehicle (PHEV) cells and minimize losses incurred against fixed engineering, cost, and financial factors packs from two estimation methods capacity investments.
7 Anticipated strong only, and does not attempt to account market data surveys (market Price ) market growth may also incentivize for market or economic factors such as and bottom-up cost models (modeled manufacturers to remain in the market supply-demand imbalances. As such, the Price , modeled cost) as well as the and to seek long-term supply agreements CEMAC modeled Price can be expected Department of Energy's Office with large-volume customers. These to approximate observed pricing when of Energy Efficiency and Renewable agreements, while priced aggressively industry conditions are free of major Energy's Vehicle Technologies Office compared to manufacturing costs today, market and commercial factors such as (VTO) modeled lab achieved costs for may deliver attractive profitability on a those noted above.
8 Comparing the 2015. pack and cells combined. The market and present value basis over their term given modeled Price to observed market prices modeled prices represent the manufac- the secured sales volumes combined with (Figure 1, left) suggests that market turers' selling prices for the component an anticipated technology-driven cost factors, not manufacturing cost consid- (cell or pack) for commercial available reduction roadmap. Finally, most major erations, currently influence pricing technology, the modeled costs are cell suppliers are diversified corporations decisions. This is further substantiated by intended to estimate manufacturers' costs that may subsidize their battery manufac- comparing both the CEMAC and BNEF.
9 Of production for this same technology, turing efforts with profits from other lines cost modeling results (Figure 1, right). and the VTO modeled costs represent the of business for strategic reasons. Each of to observed prices, which suggests that projected costs of future high-volume these nontechnical factors can lead to a manufacturers have sold at or even below pack (cells plus pack) production of disproportionate rate of Price reduction their costs of production in recent years. near- commercial technologies currently compared to reductions in the cost of in the VTO research and development production, and may be responsible for (R&D) portfolio. a share of the observed drop in reported Distinction Between prices between 2014 and 2015.
10 Modeled Cost of Current Three observations emerge when Technology and VTO Lab inspecting these disparate sets of values Modeled Price and Achieved Cost together. First, the market Price data show a significant Price drop between Cost versus Observed The CEMAC and BNEF cost modeling 2014 and 2015 (11% to 35%, depending Market Prices results presented in Figure 1 are on source). Second, the 2015 modeled intended to benchmark the then-current Techno-economic models of manu- Price is higher than market reported cost of light-duty PHEV cell and pack facturing costs and prices can be used prices for that same year. Third, the production of commercially available to help illustrate the degree to which modeled VTO lab-achieved cost is more technology.