Transcription of Country of Birth, Ethnicity and Nationality of ...
1 2011 census Country of Birth, Ethnicity and Nationality of lincolnshire Residents Introduction This report analyses the national and ethnic makeup of lincolnshire . It focuses mainly on responses to questions in the 2011 census relating to Country of birth, but also uses Nationality , Ethnicity and main language spoken as supporting information. It identifies changes in patterns since the 2001 census and examines the differences between the local authority districts in lincolnshire in relation to England and East Midlands. All the data in this report was sourced from the Office for National Statistics 2001 and 2011 population censuses. Headlines of lincolnshire residents were born outside the UK; hold only a non-British passport. Between 2001 and 2011 the number of lincolnshire residents who were born outside the UK more than doubled. Lincoln, Boston and South Holland have the greatest proportion of foreign-born residents, especially those from new EU accession states.
2 The non-white population make up of the total population in 2011 compared to in 2001. However this proportion is still small when compared with the national non-white population of 14%. Foreign born residents of lincolnshire are generally younger and more economically active. Over 28,500 people speak a foreign language as their main language. of those speak English well which is below the national average.[Publish Date] lincolnshire Research Observatory | 2011 census | Country of Birth, Ethnicity and Nationality of lincolnshire Residents Country of Birth According to the 2011 census , the population of lincolnshire was 713,653 in April 2011 . Out of all usual residents 50,743 were born outside the UK, which makes up of the population. This is lower than the rate for England ( ) and for the East Midlands ( ). The proportion of foreign born population in Lincoln ( ) and South Holland ( ) is above lincolnshire average.
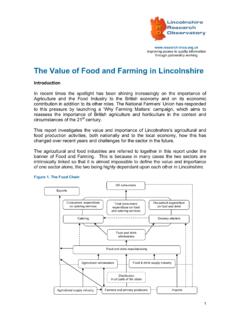
3 Boston is the only district in lincolnshire where proportion of non-UK born ( ) is higher than England's rate. Figure 1 Proportion of non-UK born residents Crown Copyright and database right 2013. Ordnance Survey 100025370 Page 2 lincolnshire Research Observatory | 2011 census | Country of Birth, Ethnicity and Nationality of lincolnshire Residents In the above map (Figure 1), areas coloured yellow have a proportion of non-UK born population similar to the national average. Areas coloured red relate to output areas where the proportion of non-UK born is double the England and Wales rate or higher. Since 2001 the proportion of people born outside the UK increased more in lincolnshire than in England. The number of non-UK born residents doubled in lincolnshire in the last 10 years. The most dramatic increase was seen in Boston district, where the proportion of foreign-born residents increased from to This change is mainly due to international in-migration in recent years.
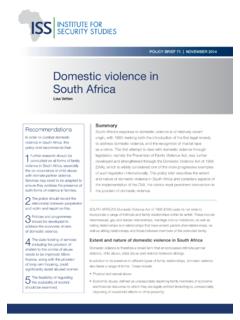
4 Figure 2 People born outside the UK as % of whole population In terms of Country of origin, the vast majority of people born outside the UK in lincolnshire came from Europe, and mainly from EU countries which became members between 2001 and 2011 . In lincolnshire 3% of residents were born in new EU accession countries (mainly Poland or Lithuania) compared to 2% in England. The proportion of the population born in those countries is especially high in Boston ( ) and South Holland ( ) while the rates for East and West Lindsey are below the national average ( and respectively). The proportion of residents coming from other European states is in lincolnshire , which is below the England rate (3%). The proportion of people born in the Middle East and Asia is significantly lower in lincolnshire ( ) than in England ( ) or in the East Midlands ( ). Out of all 0%2%4%6%8%10%12%14%16%20012011 Page 3 lincolnshire Research Observatory | 2011 census | Country of Birth, Ethnicity and Nationality of lincolnshire Residents of the people originating from Asia and the Middle East were born in South Asia (countries like India, Pakistan or Afghanistan), in South - East Asia (Thailand, Burma, Malaysia etc.)
5 And 20% from Eastern Asia ( China, Hong Kong, Japan). The proportion of people born in African countries is also much lower in lincolnshire ( ) than in England ( ). Page 4 lincolnshire Research Observatory | 2011 census | Country of Birth, Ethnicity and Nationality of lincolnshire Residents Table 1 Population by Country of birth Country of Birth Boston East Lindsey Lincoln North Kesteven South Holland South Kesteven West Lindsey lincolnshire East Midlands England Total 64,637 136,401 93,541 107,766 88,270 133,788 89,250 713,653 4,533,222 53,012,456 United Kingdom 54,847 131,367 84,383 102,182 79,830 124,669 85,632 662,910 4,085,011 45,675,317 EU (Members in March 2001) 1,202 1,554 2,152 1,979 1,450 2,510 1,331 12,178 70,849 1,290,090 EU (Accession countries April 2001 to March 2011 ) 6,839 1,275 3,607 1,229 5,241 2,806 518 21,515 91,725 1,085,351 Rest of Europe 201 221 262 180 183 273 122 1,442 12,940 299,562 Africa 416 533 844 618 483 1,024 500 4,418 84,224 1,290,611 Middle East and Asia 843 927 1,719 907 714 1,629 775 7,514 153,293 2,529,137 The Americas and the Caribbean 227 355 464 485 294 660 287 2,772 28,776 663,091 Antarctica and Oceania (including Australasia) 62 169 110 186 75 217 85 904 6,398 179,200 Other - - - - - - - - 6 97 Country of Birth Boston East Lindsey Lincoln North Kesteven South Holland South Kesteven West Lindsey lincolnshire East Midlands England United Kingdom EU (Members in March 2001) EU (Accession countries April 2001 to March 2011 )
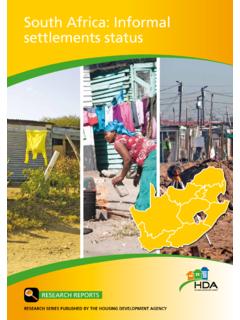
6 Rest of Europe Africa Middle East and Asia The Americas and the Caribbean Antarctica and Oceania (including Australasia) Other Page 5 lincolnshire Research Observatory | 2011 census | Country of Birth, Ethnicity and Nationality of lincolnshire Residents Figure 3 - People born outside the UK by Country of birth In the last 10 years there was a small increase in the Asian population in lincolnshire ( ).The increase in the population originating from Africa was higher ( ) however there were only 4,400 people born in Africa living in lincolnshire in 2011 , making up of the entire population. The population of people born in the European countries was just below 9,500 in lincolnshire in 2001. In the following 10 years this number increased to over 35,000 ( increase).
7 This change was mainly caused by international in-migration following the expansion of the European Union in 2004. Changes in the EU structure granted the freedom of movement and access to the job market to people from new member states like Poland, Lithuania or Latvia. The number of people born in 'old' EU states (counties like Ireland, Spain, Portugal, or Germany) who now live in lincolnshire increased by , which is smaller than the increase seen nationally ( ).. 0%20%40%60%80%100%EnglandEast MidlandsLincolnshireWest LindseySouth KestevenSouth HollandNorth KestevenLincolnEast LindseyBostonEU countries (memberbefore 2001)EU countries (joinedafter 2001) Rest of EuropeAfricaMiddle East and AsiaThe Americas and theCaribbeanAntarctica and OceaniaPage 6 lincolnshire Research Observatory | 2011 census | Country of Birth, Ethnicity and Nationality of lincolnshire Residents Nationality and Ethnicity Out of 713,653 usual residents in lincolnshire (507,288 people) held a British passport.
8 Declared that they don't have a passport, while held only a foreign passport. Analysis of Nationality shows similar pattern to Country of birth. People from new EU countries are the largest non-British Nationality in lincolnshire . The difference between foreign-born residents and those holding overseas passport is much smaller for EU countries than for other groups of migrants. Those differences are due to the more established nature of migrants from countries like India or Pakistan, many of whom came to the UK years ago and have since gained British Nationality . Additionally due to the free movement rights of EU citizens they don't need to acquire UK Nationality in order to live and work in the UK. Figure 4 - People born overseas and foreign nationals as a proportion lincolnshire population It is important to remember that some British citizens may have been born outside the UK and then moved back.
9 Those will be shown as foreign-born on the census . Similarly many children born in the UK to parents holding foreign passports will acquire the Nationality of their parents. Analysis of Ethnicity shows a very similar picture of lincolnshire to Country of birth. For example people describing their ethnic background as Asian or Asian British 0%1%2%3%4%EU - Member countries inMarch 2001EU - Accession countriesApril 2001 to March 2011 Rest of EuropeAfricaMiddle East and AsiaThe Americas and theCaribbeanAntarctica and OceaniaPlace of BirthPassportPage 7 lincolnshire Research Observatory | 2011 census | Country of Birth, Ethnicity and Nationality of lincolnshire Residents account for 1% of the lincolnshire population and people whose Ethnicity is classified as 'Black' make up of the population. In terms of Ethnicity , lincolnshire has become more diverse with the non-white population making up of the total population in 2011 compared to in 2001.
10 However this proportion is still small when compared with a national non-white population of 14%. Age Structure of UK and non UK-born Residents of lincolnshire People born outside the UK tend to be younger than the general population of lincolnshire . Over a quarter of people born outside the UK were aged 25-34 in April 2011 . The same age group makes up of the general population in lincolnshire . At the same time people aged 65 and over make up only of non-UK born population, while the same age group accounts for of the population. Figure 5 - lincolnshire residents age structure Differences in age structure are even greater in Boston and South Holland districts, where nearly a third of the non-UK born population was aged between 25 and 34. This is linked to the fact that those districts have the largest proportion of new-comers from new EU membership countries who are generally younger than other groups of migrants.