Transcription of COVID-19 in Ontario: January 15, 2020 to March 6, 2022
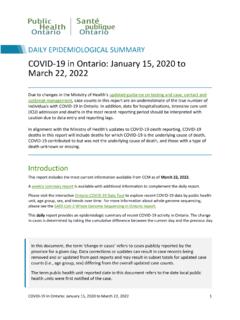
1 DAILY EPIDEMIOLOGICAL SUMMARY. COVID-19 in Ontario: January 15, 2020 to March 6, 2022. Due to changes in the Ministry of Health's updated guidance on testing and case, contact and outbreak management, case counts in this report are an underestimate of the true number of individuals with COVID-19 in Ontario. In addition, data for hospitalizations, intensive care unit (ICU) admission and deaths in the most recent reporting period should be interpreted with caution due to data entry and reporting lags. Introduction This report includes the most current information available from CCM as of March 6, 2022. A weekly summary report is available with additional information to complement the daily report. Please visit the interactive Ontario COVID-19 Data Tool to explore recent COVID-19 data by public health unit, age group, sex, and trends over time. For more information about whole genome sequencing, please see the SARS CoV-2 Whole Genome Sequencing in Ontario report. This daily report provides an epidemiologic summary of recent COVID-19 activity in Ontario.
2 The change in cases is determined by taking the cumulative difference between the current day and the previous day. In this document, the term change in cases' refers to cases publicly reported by the province for a given day. Data corrections or updates can result in case records being removed and or updated from past reports and may result in subset totals for updated case counts ( , age group, sex) differing from the overall updated case counts. The term public health unit reported date in this document refers to the date local public health units were first notified of the case. COVID-19 in Ontario: January 15, 2020 to March 6, 2022 1. Highlights There are a total of 1,114,284 confirmed cases of COVID-19 in Ontario reported to date. Compared to the previous day, this represents: An increase of 1,074 confirmed cases (percent change of ). An increase of 3* deaths (percent change of ). An increase of 1,365 resolved cases (percent change of ). * This number only includes deaths that have occurred in the last month.
3 In addition, there was 1 death that occurred more than one month ago and was added to the cumulative count based on data cleaning. Case Characteristics Table 1a. Summary of recent confirmed cases of COVID-19 : Ontario Change in Change in Cumulative case cases cases Percentage change March 6, 2022 count March 5, March 6, compared to March 5, 2022 as of March 6, 2022 2022 2022. Total number 1,787 1,074 1,114,284. of cases Number of 17 3 12,574*. deaths Number 1,645 1,365 1,085,011. resolved Note: The number of cases publicly reported by the province each day may not align with case counts reported to public health on a given day; public health unit reported date refers to the date local public health was first notified of the case. Data corrections or updates can result in case records being removed and or updated from past reports. The number of deaths presented in the change in cases column for each day only includes deaths that occurred in the last 30 days. * There was 1 death that occurred more than one month ago and was added to the cumulative count based on data cleaning.
4 Data Source: CCM. COVID-19 in Ontario: January 15, 2020 to March 6, 2022 2. Table 1b. Summary of recent confirmed cases of COVID-19 by age group and sex: Ontario Change in cases Change in cases Cumulative case count March 5, 2022 March 6, 2022 as of March 6, 2022. Sex: Male 751 471 529,933. Sex: Female 1,001 584 577,941. Ages: 0-4 54 40 33,261. Ages: 5-11 131 89 67,093. Ages: 12-19 247 107 95,917. Ages: 20-39 569 338 426,162. Ages: 40-59 494 321 309,204. Ages: 60-79 203 130 134,176. Ages: 80 and over 90 48 48,099. Note: Not all cases have an age or sex reported. Data corrections or updates can result in case records being removed and or updated from past reports and may result in subset totals ( , age group, sex) differing from past publicly reported case counts. Data Source: CCM. Table 2. Summary of recent confirmed cases of COVID-19 in long-term care homes: Ontario Change in Change in cases cases Cumulative case count as of March Long-term care home cases March 5, March 6, 6, 2022.
5 2022 2022. Residents 58 12 24,909. Health care workers 11 5 11,518. Deaths among residents 2 0 4,497. Deaths among health care 0 0 10. workers Note: Information on how long-term care home residents and health care workers are identified is available in the technical notes. Also, the change in cases in these categories may represent existing case records that have been updated. Data Source: CCM. COVID-19 in Ontario: January 15, 2020 to March 6, 2022 3. Time Figure 1. Confirmed cases of COVID-19 by likely acquisition and public health unit reported date: Ontario, January 15, 2020 to March 6, 2022. Note: Changes in testing eligibility went into effect on December 31, 2021, limiting access to testing and resulting in a change in the population being tested. Data Source: CCM. COVID-19 in Ontario: January 15, 2020 to March 6, 2022 4. Figure 2. Number of COVID-19 tests completed and percent positivity: Ontario, March 49, 2020 to March 5, 2022. Note: The number of tests performed does not reflect the number of specimens or persons tested.
6 More than one test may be performed per specimen or per person. As such, the percentage of tests that were positive does not necessarily translate to the number of specimens or persons testing positive. Changes in testing eligibility went into effect on December 31, 2021, limiting access to testing and resulting in a change in the population being tested. Data Source: The Provincial COVID-19 Diagnostics Network, data reported by member microbiology laboratories. COVID-19 in Ontario: January 15, 2020 to March 6, 2022 5. Severity Figure 3. Confirmed deaths among COVID-19 cases by date of death: Ontario, March 4, 2020 to March 6, 2022. Note: Cases without a death date are not included in the figure. Data Source: CCM. COVID-19 in Ontario: January 15, 2020 to March 6, 2022 6. Table 3. Confirmed cases of COVID-19 by severity: Ontario Cumulative case count as of Percentage of all Blank cell March 6, 2022 cases Cumulative deaths reported (please note there 12,574 may be a reporting delay for deaths).
7 Deaths reported in ages: 19 and under 14 < Deaths reported in ages: 20-39 142 < Deaths reported in ages: 40-59 903 Deaths reported in ages: 60-79 4,192 Deaths reported in ages: 80 and over 7,321 Ever in ICU 7,812 Ever hospitalized 42,263 Note: Not all cases have an age reported. Data corrections or updates can result in case records being removed and/or updated and may result in totals differing from past publicly reported case counts. Percentage of deaths reported for each age group is calculated using all cases in the age group as the denominator. Data Source: CCM. COVID-19 in Ontario: January 15, 2020 to March 6, 2022 7. Geography Table 4. Summary of recent confirmed cases of COVID-19 by public health unit and region: Ontario Change in Change in cases cases Cumulative Cumulative rate per Public Health Unit Name March 5, March 6, case count 100,000 population 2022 2022. Northwestern Health Unit 45 8 5,226 6, Thunder Bay District Health 42 31 9,002 5, Unit TOTAL NORTH WEST 87 39 14,228 5, Algoma Public Health 44 36 5,443 4, North Bay Parry Sound District 27 9 4,002 3, Health Unit Porcupine Health Unit 56 11 5,702 6, Public Health Sudbury &.
8 76 49 11,544 5, Districts Timiskaming Health Unit 7 5 1,185 3, TOTAL NORTH EAST 210 110 27,876 4, Ottawa Public Health 104 69 63,424 6, Eastern Ontario Health Unit 21 11 13,751 6, Hastings Prince Edward Public 34 14 7,072 4, Health Kingston, Frontenac and Lennox & Addington Public 67 33 10,671 5, Health Leeds, Grenville & Lanark 14 15 6,866 3, District Health Unit Renfrew County and District 16 8 3,436 3, Health Unit TOTAL EASTERN 256 150 105,220 5, COVID-19 in Ontario: January 15, 2020 to March 6, 2022 8. Change in Change in cases cases Cumulative Cumulative rate per Public Health Unit Name March 5, March 6, case count 100,000 population 2022 2022. Durham Region Health 82 49 53,595 7, Department Haliburton, Kawartha, Pine 17 18 7,203 3, Ridge District Health Unit Peel Public Health 143 57 172,706 11, Peterborough Public Health 17 8 5,708 3, Simcoe Muskoka District 78 29 36,196 5, Health Unit York Region Public Health 78 55 98,686 8, TOTAL CENTRAL EAST 415 216 374,094 8, Toronto Public Health 270 187 280,276 9, TOTAL TORONTO 270 187 280,276 9, Chatham-Kent Public Health 16 8 6,979 6, Grey Bruce Health Unit 26 16 6,417 3, Huron Perth Public Health 17 3 5,777 3, Lambton Public Health 21 12 9,844 7, Middlesex-London Health Unit 73 58 32,141 6, Southwestern Public Health 16 18 11,306 5, Windsor-Essex County Health 84 58 37,665 8, Unit TOTAL SOUTH WEST 253 173 110,129 6, Brant County Health Unit 9 7 9,945 6, City of Hamilton Public Health 65 50 48,763 8, Services Haldimand-Norfolk Health Unit 18 2 7,129 5, COVID-19 in Ontario: January 15, 2020 to March 6, 2022 9.
9 Change in Change in cases cases Cumulative Cumulative rate per Public Health Unit Name March 5, March 6, case count 100,000 population 2022 2022. Halton Region Public Health 53 34 42,668 6, Niagara Region Public Health 84 40 34,517 7, Region of Waterloo Public 33 42 40,788 6, Health and Emergency Services wellington -Dufferin-Guelph 34 24 18,651 5, Public Health TOTAL CENTRAL WEST 296 199 202,461 7, TOTAL ONTARIO 1,787 1,074 1,114,284 7, Notes: Health units with data corrections or updates could result in records being removed from totals, leading to negative or zero counts. Data Source: CCM. Outbreaks Table 5. Summary of recent confirmed COVID-19 outbreaks reported in long-term care homes, retirement homes and hospitals by status: Ontario Change in Change in Number of Cumulative number of Institution type outbreaks outbreaks ongoing outbreaks outbreaks reported March 5, 2022 March 6, 2022. Long-term care 2 1 66 2,163. homes Retirement 1 3 42 1,464. homes Hospitals 3 0 33 1,149.
10 Note: Ongoing outbreaks are those that are reported in CCM as Open' and without a Declared Over Date'. recorded. The start of the outbreak is determined by the onset date of first case, or if missing the outbreak reported date, or else if that is also missing, then the outbreak created date. Data Source: CCM. COVID-19 in Ontario: January 15, 2020 to March 6, 2022 10. Technical Notes Data Sources The data for this report were based on information successfully extracted from the Public Health Case and Contact Management Solution (CCM) for all PHUs by PHO as of March 6, 2022 at 1. for cases reported from May 1, 2021 onwards and as of March 4, 2022 at 9 for cases reported up to April 30, 2021. CCM is a dynamic disease reporting system, which allows ongoing updates to data previously entered. As a result, data extracted from CCM represent a snapshot at the time of extraction and may differ from previous or subsequent reports. Ontario population estimate data were sourced from Statistics Canada.
