Transcription of COVID-19 vaccines, cases, hospitalisations, deaths and ...
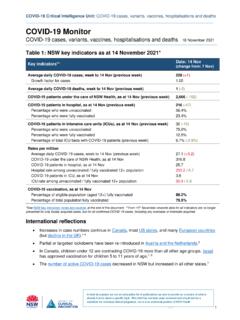
1 COVID-19 Critical Intelligence Unit: COVID-19 cases, testing, variants, vaccines, hospitalisations and deaths 1 COVID-19 Monitor COVID-19 cases, testing, variants, vaccines, hospitalisations and deaths 07 October 2021 Table 1: NSW key indicators as at 05 October 2021* *Please see notes and sources at the end of this document. Key indicators Date: 02 Oct (previous week: 25 Sep) Average daily COVID-19 locally acquired cases, week to 02 Oct 839 Compared to previous week 1,013 (-174) Growth factor for locally acquired cases Doubling time (days) NA Average daily COVID-19 deaths , week to 02 Oct 10 Compared to previous week 8 (+2) COVID-19 patients under the care of NSW Health, as at 02 Oct 10,525 Compared to previous week 13,049 (-2,524) COVID-19 patients in hospital, as at 02 Oct 975 Compared to previous week 1,141 (-166) Percentage of patients unvaccinated Percentage of patients fully vaccinated COVID-19 patients in intensive care units (ICU), as at 02 Oct 194 Compared to previous week 221 (-27)
2 Percentage of patients unvaccinated Percentage of patients fully vaccinated Percentage of total ICU beds Compared to previous week ( ) Rates per million Average daily COVID-19 locally acquired cases (per million), week to 02 Oct (previous week) (-21) COVID-19 under the care of NSW Health (per million), as at 02 Oct COVID-19 patients in hospital (per million), as at 02 Oct COVID-19 patients in ICU (per million), as at 02 Oct COVID-19 vaccination, as at 02 Oct Number of persons aged 16+ given 1+ dose 5,812,301 Percentage of persons aged 16+ given 1+ dose Compared to previous week + (Average increase, the past four weeks) (+ ) Number of persons aged 16+ fully vaccinated 4,413,848 Percentage of persons aged 16+ fully vaccinated Compared to previous week + (Average increase, the past four weeks) (+ ) COVID-19 Critical Intelligence Unit: COVID-19 cases, testing, variants, vaccines, hospitalisations and deaths 2 Background Jurisdictions globally are facing different situations when it comes to COVID-19 cases, distribution of new variants, patient outcomes, vaccine rollout and testing.
3 Understanding how these variables interplay as the pandemic progresses can provide insights for NSW. Evidence Initially, in countries with high vaccination rates, such as the United States, Israel and Canada, low rates of new infections were being reported in vaccinated However, there are reports of sharp rises in case numbers in countries such as Israel following Delta s arrival, despite more than 60% of the population being fully As case numbers rise, alternative testing approaches to the gold standard polymerase chain reaction (PCR) testing may be These approaches include at-home testing, frequent rapid antigen tests (RAT), age-group-target testing, using samples of individuals from different households, or electronic screening using self-reported RAT have value as a screening step before PCR testing to confirm diagnosis, in particular with outbreaks where there is high local disease prevalence (such as currently in Sydney).
4 8, 12, 13 The Therapeutic Goods Administration (TGA) will allow applications for regulatory approval to supply RAT for use at home in Australia after 1 November Viruses constantly change through mutation and new variants are expected over time. For SARS-CoV-2, there are four variants of concern as determined by the World Health Organization: o Alpha ( ), originated in the United Kingdom and currently reported in 195 countries. o Beta ( ), originated in South Africa and currently reported in 145 countries. o Gamma ( or ), originated in Brazil and currently reported in 99 countries. o Delta ( ), originated in India and currently reported in 192 COVID-19 vaccines are effective at preventing severe disease. Real-world effectiveness data on hospitalisations and mortality following vaccination (namely Pfizer, AstraZeneca, Moderna and Sinovac) show vaccines are 71% to 98% effective at preventing COVID-19 -related hospitalisation and 88% to 97% effective at preventing COVID-19 -related Generally, vaccines are effective at neutralising Alpha, while there is reduced neutralisation for Gamma, Beta and Delta.
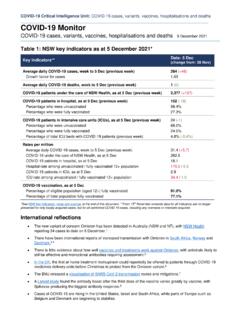
5 All variants elicit cross-reactive neutralising , 22-25 COVID-19 Critical Intelligence Unit: COVID-19 cases, testing, variants, vaccines, hospitalisations and deaths 3 Table 2: Summary of public health, healthcare and vaccination measures (select countries and NSW) as at 05 October 2021* NSW Australia United Kingdom United States Canada Israel Denmark Portugal Average daily confirmed cases 839 2,127 33,482 105,054 4,058 3,324 451 590 Average daily confirmed cases (per million) Fully vaccinated (%) COVID-19 patients in hospital 975 1,496 6,556 63,867 2,343 751 85 415 COVID-19 patients in hospital (per million) COVID-19 patients in ICU 194 296 805 18,621 764 237 17 83 COVID-19 patients in ICU (per million) Notes * For the selected countries, data is presented for 04 October 2021, accessed on 05 October 2021.
6 For some measures, data were not available for 04 October, in which case the latest available data is shown. For NSW, data is presented for 02 October, accessed on 05 October 2021. Average daily confirmed cases and average daily vaccine doses are based on a seven-day average. Proportions for population covered are based on the full population Patients in hospital include both cases on the ward and in ICUs. ICU data for NSW does not include cases in ICUs within paediatric hospitals. Sources New cases for selected countries sourced on 05 October 2021 from Our World in New cases for NSW sourced from NSW Health via the Notifiable Conditions Information Management Vaccination data for selected countries sourced on 05 October 2021 from Our World in Vaccination data for NSW sourced from NSW Health via the Australian Government Department of Health Australian Immunisation Data on the number of COVID-19 patients in hospital and ICUs were sourced on 05 October 2021 from: o for all countries (aside from Australia): Our World in Data26 o for Australia: COVID LIVE, which verifies data against Australian state and territory government health departments29 o for NSW.
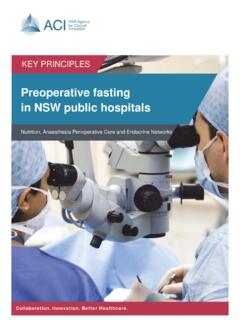
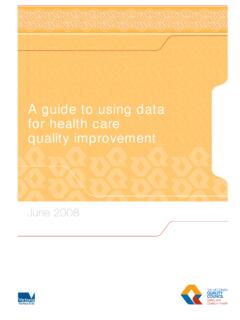
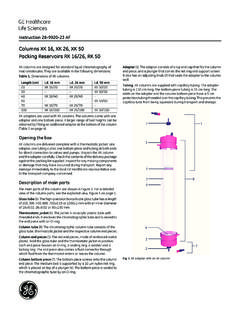
7 NSW Health via the Patient Flow Portal, taken from a 7pm snapshot, 02 October COVID-19 Critical Intelligence Unit: COVID-19 cases, testing, variants, vaccines, hospitalisations and deaths 4 COVID-19 testing rates Figure 1 shows the daily rate per thousand population (rolling seven-day average) of COVID-19 tests in NSW, Australia, United Kingdom, United States, Canada, Israel, Portugal, Denmark and India, from April to October 2021. Figure 1: Daily rates of COVID-19 tests (select countries and NSW), April October 2021 Note: When comparing testing data across different countries, differences in ways of reporting may affect interpretation of data. Source: Data for the selected countries sourced from Our World in Data for NSW sourced from NSW Health via the Notifiable Conditions Information Management Both accessed 5 October 2021.
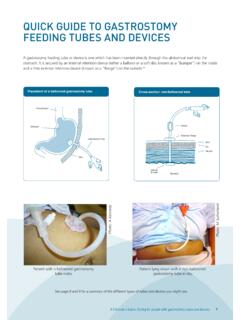
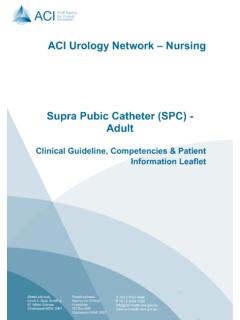
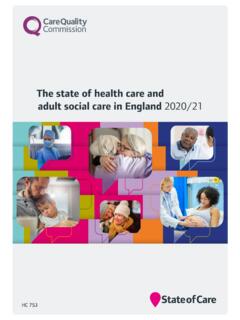
8 COVID-19 Critical Intelligence Unit: COVID-19 cases, testing, variants, vaccines, hospitalisations and deaths 5 COVID-19 confirmed cases Figure 2 shows the daily rate per million population (rolling seven-day average) of confirmed COVID-19 cases in NSW, Australia, United Kingdom, United States, Canada, Israel, Portugal, Denmark and India, from April to October 2021. Data is presented on a log (base 10) scale. Figure 2: Daily rates of COVID-19 cases (select countries and NSW), April October 2021 Note: Limited testing and delayed reporting likely result in underestimation of the actual number of confirmed cases. Source: Data for the selected countries sourced from Our World in Data for NSW sourced from NSW Health via Notifiable Conditions Information Management Both accessed 5 October 2021.
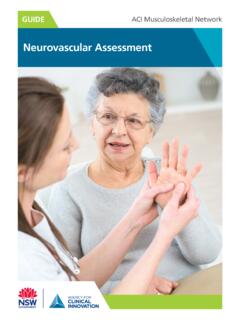
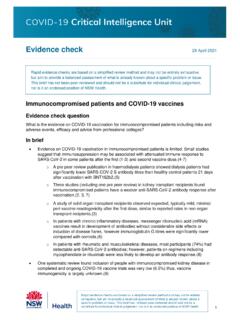
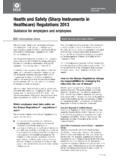
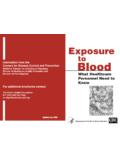
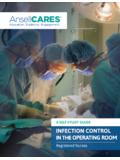
9 1000+100-100010-1001-100-1 COVID-19 Critical Intelligence Unit: COVID-19 cases, testing, variants, vaccines, hospitalisations and deaths 6 COVID-19 vaccination rates Figure 3 shows the daily (rolling seven-day average) vaccination rate per hundred population in NSW, Australia, United Kingdom, United States, Canada, Israel, Portugal, Denmark and India, from April to October 2021. Figure 3: Daily vaccination rates (select countries and NSW), April October 2021 Note: Vaccination rates for NSW are shown for the eligible (ages 16+) population. Source: Data for the selected countries sourced from Our World in Data for NSW is sourced from NSW Health via the Australian Government Department of Health Australian Immunisation Both accessed 5 October 2021. COVID-19 Critical Intelligence Unit: COVID-19 cases, testing, variants, vaccines, hospitalisations and deaths 7 COVID-19 mortality rates Figure 4 shows the daily (rolling seven-day average) mortality rate per million population in NSW, Australia, United Kingdom, United States, Canada, Israel, Portugal, Denmark and India, from April to October 2021.
10 Figure 4: Daily mortality rates (select countries and NSW), April October 2021 Note: Limited testing and challenges in the attribution of the cause of death means that the number of confirmed deaths may not be an accurate count of the true number of deaths from COVID-19 . Source: Data for the selected countries sourced from Our World in Data for NSW sourced from NSW Health via the Notifiable Conditions Information Management Both accessed 5 October 2021. COVID-19 Critical Intelligence Unit: COVID-19 cases, testing, variants, vaccines, hospitalisations and deaths 8 COVID-19 cases, testing, variants, vaccines, hospitalisations and deaths The following graphs (figures 5-10) show COVID-19 cases and vaccination rates; hospitalisation and death rates; and the variant distribution for NSW, Australia, United Kingdom, United States, Canada and Israel.