Transcription of Creating a New SPSS Dataset -- Variable …
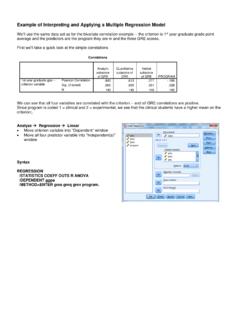
1 Creating a New spss Dataset -- Variable specification and Data Entry When you open spss you will see the Data Editor This shows the Data View of the editor. Each row holds the data from a participant or case . Each column holds the data for a Variable After specifying the information for each Variable using the Variable View of the editor, we will return to this Data View to enter the data from each case. This shows the Variable View of the editor. Each row holds the specification for a Variable Each column holds a different specification It is important to specify key aspects of each Variable . These specifications will make the statistical analyses and output clearer and easier to read as well as provide a reminder of the decisions you made when collecting and entering the data.
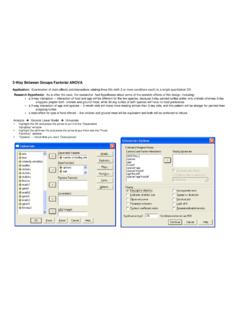
2 The initial form of most datasets is a listing of the Variable values for each participant. Participant number -- usually consecutive numbers starting with 1, 001 or some Usually each row is a different participant with a column for each Variable that was similar numbering system collected. Type of reptile department -- 1 means tha reptile displays are mixed in with other animal and prduct displays and 2 means that the store Below are the data for 12 participants. Each participant is a different pet store. The has a separate department researchers visited each store and recorded information about eight variables. Those variables and details about each are shown on the right Rating of the quality of the reptiles -- using a 1-10 scale 1 1 2 12 1 6 32 3 34 Count of the number of reptiles in the store 2 2 8 14 2 5 41 3 38.
3 Type if fish avaiable -- 1 means only freswhater fish are available in the store and 3 2 9 15 2 3 31 3 45 2 means that both freshwater and saltwater fish are available 4 2 7 12 2 3 38 3 32. 5 1 4 7 1 7 21 1 12 Rating of the quality of the fish -- using a 1-10 scale 6 1 7 4 2 9 13 1 11 Count of the number of fish in the store 7 2 4 10 2 9 17 2 22. 8 1 4 4 1 8 22 1 9 The ownership of the store -- 1 mean s the store is a franchise of a petstore chain, 2 means the store is privately owned, and 3 means 9 1 5 14 1 6 24 2 20 the store is part of a petstore cooperative 10 2 9 4 1 9 11 1 8. 11 2 7 5 2 7 17 2 19 Count of the number of mammals in the store 12 1 2 10 1 8 20 1 8.
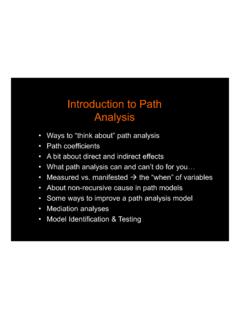
4 Naming Variables Click a cell under Variable and type in the Variable name Variable names may have up to 8 characters -- letters, numbers, - and _ work best -- the first character must be a letter When you enter a name for a Variable a set of default values automatically appears in the other columns -- some of these we will change later The Variable names for these data are shown to the right, along with the default values Type, Width & Decimals The default values for these specifications usually work very well. Numerical is the most common type for both qualitative & quantitative data Width tells the number of digits in the largest Variable value -- must be at least one more than the number of decimal values Decimals tells how many digits of a Variable value are decimal values Variable Labels Click a cell under Label and type up to a 40-character description of the Variable -- this label will appear in the output making it easier to understand giving a Label to every Variable in the data set prevents forgetting what the 8-character Variable names mean Value Labels Specify Values for every qualitative Variable -- these will appear in the output Click a
5 Cell under Values. Click the gray box that appears in the cell -- shown on the left for reptdept in row 2. The Value Labels window will appear. In it type each Value, its Value Label , and click Add -- shown to the right for the value 2 of reptdept You can also highlight a specified value label and Change or Remove it later Missing Values leaving a cell in the Dataset blank tells spss that value for that partici pant has a missing value for that Variable -- a . will appear in that cell, signalling a system missing value . you can also identify alternative user-missing values to indicate different types of missing data ( , -99 = did not respond, -98 =.)
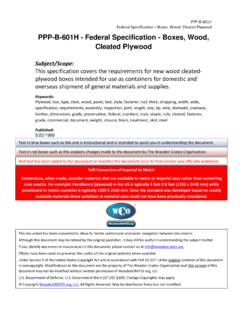
6 Answer could not be scored -- up to 3 different missing values). Click the cell under Missing. Click the little gray box that appears in the cell -- shown on the left for reptdept in row 2. Click the Discrete missing values button and enter the missing values you've chosen in the windows -- shown below for -9 for reptdept Be sure to specify the meaning of each missing value in the Values column Entering Data Click the Data View tab in the botton-left corner of the screen Enter each Variable value -- in the correct column -- for each case or participant If you leave a space blank a . will appear, indicating that the value is missing -- called a system missing value The completed data set for the petstores is shown below.
7 These data will be used for many of the data analysis examples in this handbook Saving the Dataset File then Save As and proceed with the usual Windows save routine spss data sets have the extension .sav.