Transcription of Current oil price trends
1 38 ECB Economic Bulletin, Issue 2 / 2016 Box 2 Box 2 Current oil price trendsOil prices have fallen by 70% since July 2014. Taking a longer-term perspective, the oil price drop can be explained by previous large investments and technological innovations that caused oil production to surge at a time of weakening growth. Technological breakthroughs sparked the shale oil revolution in the United States, and several years of high oil prices, against a backdrop of strong growth in emerging market economies, encouraged large-scale investment in oil. Owing to a considerable lag between investment and production, the resulting supply entered the market when demand for oil was no longer increasing. Although shale oil supply started increasing and global demand growth started slowing as early as 2010 ( in China), supply disruptions in major oil-producing countries (Libya, Iran, Russia and Iraq) linked to geopolitical tensions supported oil prices for several years before they fell abruptly in the summer of 2014.
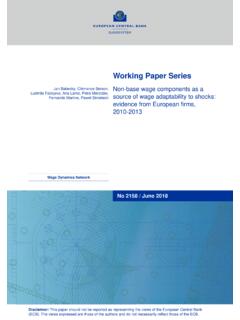
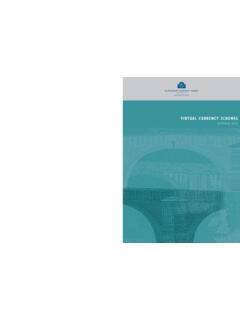
2 The strategic decision of the Organization of the Petroleum Exporting Countries (OPEC) not to offset the price decline with a cut in production, taken at its November 2014 meeting, caused prices to drop both demand and supply factors have driven the fall in oil prices since 2014, model-based results show that the initial decline can mostly be explained by supply increases. More recently, however, demand has been the dominant factor (see Chart A). According to staff calculations, around 60% of the 2014 decline was driven by supply factors. After a rebound in the first two quarters of 2015, oil prices dropped again, with demand factors playing an increasing role. This is largely a reflection of the slowdown in aggregate demand, while lower price expectations linked to growth in emerging markets and OPEC s decision not to cut supply (as captured by the precautionary demand shock) also contributed to the recent decline.
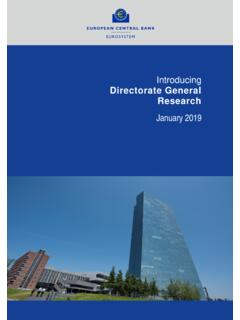
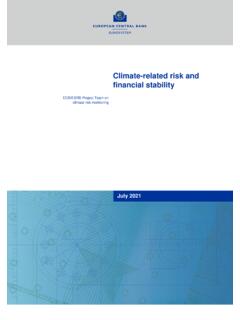
3 OPEC supply has trended upwards since mid-2014, while oil demand from non-OECD countries remained strong during 2015. Oil demand from OECD countries declined at the end of 2015, mainly owing to mild winter conditions in the United States and Europe as well as weaker economic sentiment in large emerging market economies (see Chart B).Chart AModel-based oil price breakdown(left-hand scale: cumulated contributions of the different oil shocks in percentage points, July 2014 = 0; right-hand scale: nominal oil prices in USD per barrel)30405060708090100110-120-100-80-6 0-40-20020Q3 2014Q4 2014Q1 2015Q2 2015Q3 2015Q4 2015Q1 2016oil su pplyglobal aggregate demandpreca utionary oil demandoil price Source: ECB staff : The latest observation is for January 2016. The historical breakdowns have been normalised to start at zero in July 2014, when Brent crude oil prices started dropping.
4 A declining contribution indicates that a specifi c oil shock contributed to lowering oil prices and vice versa. The oil supply shock captures exogenous changes in oil production, the global aggregate demand shock captures changes in oil prices that are endogenously caused by global economic growth developments and the precautionary oil demand shock captures changes in expectations about the oil demand/supply balance in the future as refl ected in oil inventory holdings. The breakdown is based on Kilian, L. and Murphy, , The role of inventories and speculative trading in the global market for crude oil , Journal of Applied Econometrics, 29(3), 2004, pp. 454-78, using data on oil prices, global economic growth developments and the precautionary oil demand shock captures changes in expectations about the oil demand/supply balance in the future as refl ected in oil inventory holdings.
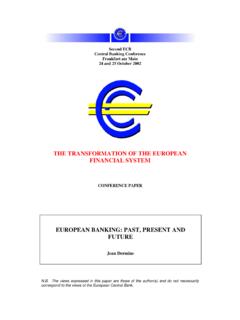
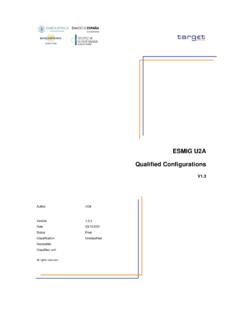
5 The breakdown is based on Kilian, L. and Murphy, , The role of inventories and speculative trading in the global market for crude oil , Journal of Applied Econometrics, 29(3), 2004, pp. 454-78, using data on oil prices, global oil production and a proxy for global oil inventories and global economic BWorld oil supply and demand(million barrels per day; year-on-year changes) 2014Q4 2014Q1 2015Q2 2015Q3 2015Q4 2015 OPEC su pplynon-OPEC su pplynon-OECD demandOECD demand Source: International Energy Economic Bulletin, Issue 2 / 2016 Box 2It will take time before the Current oversupply can be absorbed. The arrival of US shale oil and unconventional oil exploration more generally is a structural supply-side shift which might cause oil prices to stay lower for longer. An excess supply of almost million barrels per day on average over 2014-15 has caused OECD crude oil inventories to reach historical highs (see Chart C).
6 1 a rebalancing is nevertheless expected to occur over time. A theoretical lower bound for oil prices is linked to the level of the marginal cost of production of US shale oil, estimated at around USD 35 per barrel on However, several types of oil production, such as US shale oil, have continued to grow over the past year despite oil prices being below their respective estimated marginal costs. Indeed, several other factors besides these production-specific marginal costs play a role. First, marginal costs differ markedly depending on the type of oil and the specific oilfield, making these averages only a rough indicator of when production would be affected. Second, it is important to take into account cost deflation3 and increased production efficiency, marginal costs may decline owing to productivity progress. However, there is already evidence that the number of oil rigs has declined in the United States, indicating lower supply over The Current futures curve indicates that oil prices are expected to stay within a range of USD 30-45 per barrel over the next two years.
7 Relative to that projection, the downside risks to oil prices on the supply side are related to further increases in global oil production owing to a stronger than expected return of Iranian oil and the continued resilience of non-OPEC production, in particular US shale oil. On the demand side, a stronger than expected slowdown in emerging economies might affect oil demand negatively. The main upside risks are stronger than expected cutbacks in oil production owing to geopolitical tensions and larger supply fall-backs if oil prices remain persistently low. From 2017 onwards, although the main downside risks still prevail, the risks are increasingly on the upside, as high capital expenditure cutbacks might result in a faster tightening of the supply/demand balance than currently reflected in the futures curve once global economic activity picks Average global oil demand in 2014-15 was around million barrels per day and average global oil supply 95 million barrels per day.
8 Excess supply amounted to about of daily global oil Little, Arthur D., Where now for oil?, Viewpoint, Cost deflation is a general decline in the cost of oil production which, for example, can originate from production efficiency gains or lower service costs ( reduced service fees for contractors to drill oil wells or for support activities such as surveying, cementing, casing and treating wells). 4 Baker Hughes, 2016 ( ).Chart CDemand, supply and oil inventories(left-hand scale: global oil demand and supply in million barrels per day flow variable; right-hand scale: OECD crude oil inventories in million barrels stock variable)7508008509009501,0001,0501,1001 ,1501,2006065707580859095100198619901994 19982002200620102014global oil demand global oil su pply OECD cr ude oil inve ntories Source: International Energy : Annual data; the latest observation is for 2015.