Transcription of CytoFLEX Flow Cytometer Quick Start Guide
1 2015 Beckman Coulter, / 16B49008 ACFebruary 2015 CytoFLEX Flow Cytometer Quick Start GuideFor detailed instructions, refer to the CytoFLEX Flow Cytometer Instructions for Research Use Only. Not for use in diagnostic FlowStart UpInstrument all system connections are connected up QC Create Experiment Adjust Instrument Settings and Compensation Record Data Shut Container holderSheathSheathWasteCLASS 1 LASER PRODUCTCOMPLIES WITH 21 CFR AND FOR DEVIATIONS PURSUANT TOLASER NOTICE NO. 50 DATED JUNE 24, 2007 MANUFACTURED )XVH $ WLPH GHOD\ 7 $/ 9$& 3 RZHU 9$SNbcdgef2 / 16 CytoFLEX Flow Cytometer Quick Start GuideStart Up that all of the tubing and the cables are connected to the instrument according to the color that the USB configuration key has been connected to a USB of instrument damage.
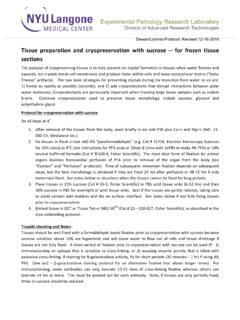
2 Remove the sheath fluid container from the Fluid Container holder and fill away from the instrument to prevent spills that could damage the instrument the sheath fluid container from the Fluid Container holder and fill the sheath fluid container with the supplied sheath necessary, remove the right side cover and fill the Deep Clean solution with a mixture of 1 part Contrad 70 and 1 part DI of chemical injury from bleach. To avoid contact with the bleach, use barrier protection, including protective eyeware, gloves, and suitable laboratory attire.
3 Refer to the Safety Data Sheet for details about chemical exposure before using the the waste container if necessary. Add 400 mL of 5 to 6% bleach to the waste Start on the power switch on the back cover of the instrument, located just above the power Waste level to the waste liquid sensor Flow cell waste out. Connects to the flow cell waste Sheath fluid level sense. Connects to the sheath fluid sensor Waste out. Connects to the waste liquid Sheath return. Connects to the sheath fluid Sheath fluid in. Connects to the sheath fluid / 16 CytoFLEX Flow Cytometer Quick Start GuideInstrument QC on to the computer and double-click to Start that the Connected icon on the Status Bar near the bottom-left side of the display is the icon is not green, ensure that the instrument USB is securely connected to the computer and restart the System Startup Procedure in the Cytometer menu and follow the software QCIMPORTANTV erify the detector configuration.
4 Ensure that the instrument settings are properly configured for the QC experiment. The QC experiment may not complete or may end in erroneous results if incorrect settings are chosen. Beckman Coulter recommends using the factory configuration and ensuring that the proper optical filters are in Start QC in the QC menu. The Acquisition screen is now replaced by the QC of erroneous QC results. Different lot numbers correspond to different target value information. Selecting the wrong lot number will lead to erroneous QC that the QC fluorosphere lot number is selectable in the Lot No.
5 Drop down menu. If the lot number is not selectable, import the lot-specific target value file. Refer to Importing Lot-Specific Target Values in Chapter 4, Instrument Quality Control of the CytoFLEX Flow Cytometer Instructions for a QC sample by adding 3 drops of Beckman Coulter supplied QC fluorospheres and 1 mL of DI water into a 75-mm test / 16 CytoFLEX Flow Cytometer Quick Start GuideData Acquisition IMPORTANTFor each new Lot number, download the corresponding target value file and refer to Step the Lot No. drop-down list on the left side of the screen, select the Lot No.
6 Corresponding to the QC , insert the prepared QC sample tube into the sample tube holder, then select to Start may take several minutes. The minimum flow rate for the QC fluorospheres is 100 events/second. The results are displayed and saved automatically once it is completed. Green icons in the Result section indicate Pass. Red icons in the Result section indicate QC fails, prime the instrument, initialize, and repeat QC fails two times in a row on the same day, contact your Beckman Coulter AcquisitionCreate the CytExpert desktop icon to open the the Start page, select New Experiment or New Experiment from Template to Start a new experiment, or Open Experiment to continue an existing contain information on hardware and software settings including channels used, gain settings, flow rate.
7 And stop / 16 CytoFLEX Flow Cytometer Quick Start GuideData Acquisition Alternatively, select New Experiment, New Experiment from Template, or Open Experiment from the File a tube has not been created, use the Tube toolbar buttons to create a new tube. To modify a tube s property, highlight the tube name then select located on the bottom, left section of the Acquisition yourself with the the desired histograms or dot plots using the Plots tool . the desired sample flow rate, then select on the Acquisition panel to Start the lasers and / 16 CytoFLEX Flow Cytometer Quick Start GuideData Acquisition a sample tube into the sample port, then select to Start acquisition and display the Threshold tool or select to set discrimination to eliminate undesired populations on the the Scale and Gain tools or select to move the population displayed on the plot to the desired location.
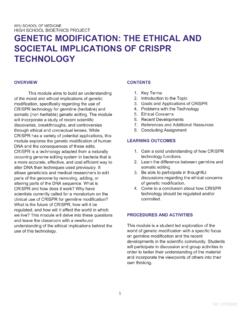
8 7 / 16 CytoFLEX Flow Cytometer Quick Start GuideAdjusting Settings and Compensation Adjusting Settings and CompensationPlots, Gates, and Statistics modify the attributes of a plot, gate, statistics table, or population hierarchy, select the plot and right click to select the attribute options. See examples below. Plot properties (right click on the gate) Gate properties (right click on gate)8 / 16 CytoFLEX Flow Cytometer Quick Start GuideAdjusting Settings and Compensation Statistics Table (right click on statistics table) Population the scale range on a plot by either using the Zoom In/Out tools or the pan tools to define the display area around the population on the plot, or by double-clicking near the axes on the plot to view the Plot Property / 16 CytoFLEX Flow Cytometer Quick Start GuideAdjusting Settings and Compensation the Gates tools to gate populations, and the Hierarchy tool to inspect and manage gated populations within a gate or Boolean logic of gates (Combo Population)
9 On a plot by left-clicking the title of the a Statistics Table by selecting the Statistics tool . The desired statistics can be displayed by right-clicking the panel and then selecting the Statistics Setting in the pop-up / 16 CytoFLEX Flow Cytometer Quick Start GuideAdjusting Settings and Compensation Compensation Matrix in the Setting menu to open the Compensation Matrix window to compensate for the fluorescence compensation matrix can be modified manually, or imported from a prior compensation matrix file, or exported for use in other Compensation Library holds compensation matrices that were previously generated from specific gain settings.
10 However, compensation calculations are Gain-independent. CytExpert generates a new, adjusted compensation matrix from the Compensation Library based on the new gain settings. This can be achieved by selecting Import from the Compensation a new, automated compensation is needed, generate as all necessary unstained and single color fluorospheres and New Compensation in the File / 16 CytoFLEX Flow Cytometer Quick Start GuideAdjusting Settings and Compensation the corresponding tubes in the pop-up Compensation Setup window, then select automatically creates a list of matching empty tubes in the Tube panel as well as all the plots needed to gate the positive and negative the corresponding unstained or single color sample fluorospheres or cells and select in the Acquisition necessary, adjust the scatter gate and the positive and negative population gates in the corresponding the gates are in satisfactory locations, select.