Example: bachelor of science

d a t a in t h e t e x t b y U lr ic h a n d V a s u d e v ...

197019801990200020102020 Year100100020030040050060070080090020003 00040005000 Cost Index, I197019801990200020102020 Marshall & SwiftNelson-Farrar Index History of selected cost indices pertinent to chemical processing. All cost data in the text by Ulrich and Vasudevan1 are based on the Chemical Engineering Plant Cost Index Value of engineeringplant cost index(CE Index = 400 is thebasis for cost datain this text)20%Slopes correspond toinflation rates as indicated10%5%2% 20%0%US Bureau of Labor Statistics- Hourly Earning Index.(Chemical & Allied Products) 1 Chemical Engineering Process Design and Economics A Practical Guide by Ulrich and Vasudevan

1970 1980 1990 2000 2010 2020 Y e a r 100 1000 200 300 400 500 600 700 800 900 2000 3000 4000 5000 C o s t I n d e x, I 1970 1980 1990 2000 2010 2020 M a r s h a l l & S w i f t

Tags:

  E t e x t, C o s t i n

Information

Domain:

Source:

Link to this page:

Please notify us if you found a problem with this document:

Other abuse

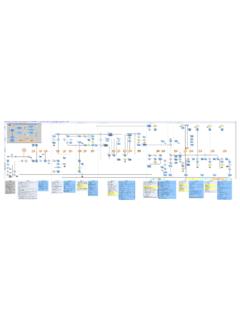
Transcription of d a t a in t h e t e x t b y U lr ic h a n d V a s u d e v ...

1 197019801990200020102020 Year100100020030040050060070080090020003 00040005000 Cost Index, I197019801990200020102020 Marshall & SwiftNelson-Farrar Index History of selected cost indices pertinent to chemical processing. All cost data in the text by Ulrich and Vasudevan1 are based on the Chemical Engineering Plant Cost Index Value of engineeringplant cost index(CE Index = 400 is thebasis for cost datain this text)20%Slopes correspond toinflation rates as indicated10%5%2% 20%0%US Bureau of Labor Statistics- Hourly Earning Index.(Chemical & Allied Products) 1 Chemical Engineering Process Design and Economics A Practical Guide by Ulrich and Vasudevan


Related search queries