Transcription of Daman Morning
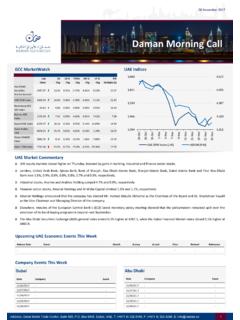
1 Address: Dubai World Trade Center, Suite 600, Box 9436, Dubai, UAE, T: (+971 4) 332 4140, F: (+971 4) 332 4240, E: 1 Daman Morning Call 14 May 2017 GCC MarketWatch UAE Indices UAE Market Commentary UAE equity markets ended in positive territory on Thursday, supported by gains in financial and banking sector stocks. Financial stocks, Dubai Investments and Amanat Holdings rose and , respectively, while Dar Al Takaful and Dubai Financial Market added , each. Insurance companies, Dubai Islamic Insurance and Reinsurance Co. and Insurance House advanced and , respectively.
2 Abu Dhabi National Energy Company soared , after the company s 1Q17 net profit surged to million, compared to a net loss of million in the previous year. Meanwhile, Amlak Finance reported a significant decline in the first quarter net profit to million from million in the last year. Waha Capital s net profit dropped to million in the first quarter, compared to million in the same period prior year. Elsewhere, the Bank of England (BoE), as widely expected, held its benchmark interest rates steady, stating that further interest rate hike decision depends on the Britain s smooth exit from the European Union in two years' time.
3 The Abu Dhabi Securities Exchange (ADX) general index ended higher at 4, , while the Dubai Financial Market index closed higher at 3, Company Events This Week Dubai Date Company Event 5/14/2017 - - 5/15/2017 - - 5/16/2017 - - 5/17/2017 - - 5/18/2017 - - Upcoming UAE Economic Events This Week Release Date Event Month Survey Actual Prior Revised Relevance 14 May - 18 May - - - - - - - Last Close 1D Chg 1D % Chg YTD% Chg 1M % Chg 1Y % Chg P/E Multiple (x) Abu Dhabi Securities Market General UAE DFM Index Bloomberg GCC 200 Index Bahrain BSE index Kuwait KSE Index Saudi Arabia TASI Oman MSM30 Index Qatar DSM Index Abu Dhabi Date Company Event 5/14/2017 - - 5/15/2017 - - 5/16/2017 - - 5/17/2017 - - 5/18/2017 - - 4,4674,5104,5534,5974,6403,3673,4153,463 3,5113,55811-Apr13-Apr17-Apr19-Apr23-Apr 25-Apr27-Apr1-May3-May7-May9-May11-MayUA E DFM Index (LHS)ADSMI (RHS)
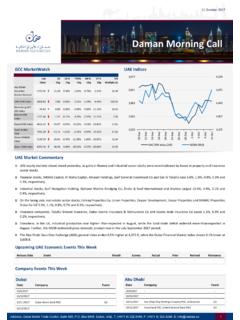
4 2 Following a lower Bollinger band crossover on the daily chart on 07 May, the stock has continued to trade higher and finished Thursday s session at , after notching a high at A possible signal line crossover by the daily MACD from below conjoined with the RSI and stochastic indicators moving higher hints at a bullish technical outlook. Important resistance is seen at the level, followed by the 20day SMA (currently placed at ) and levels. A clear break and stability above the latter might lead to further bullishness in the stock.
5 However, the weekly MACD and RSI indicators are trading with a negative bias, suggesting that the room for downside momentum still exists. Crucial support resides at the level, followed by the and the daily lower Bollinger band (currently trading at ). The stock traded with a positive showing on Thursday and ended above the 20day SMA (currently placed at ) at , following a high at Even though the weekly MACD is heading south, the RSI and stochastic oscillators are trading with a mildly positive tone, reflecting at positivity in the coming week.
6 On the daily chart, the momentum oscillators are trading with an upside tone, further affirming the above view. Key near-term resistance is located at the level, followed by the and the 50day SMA (currently trading at ). A sustained break above the latter might lead to further strength in the stock. On the contrary, important support is seen at the level, followed by the and levels. A breach below the latter might trigger negativity in the stock. The stock registered significant losses on Thursday and settled below the daily lower Bollinger band (currently placed at ) at , after making a low at As of now, the daily momentum oscillators are trading at a lower level below their midlines, hinting at a bearish technical picture.
7 On the weekly chart, the momentum oscillators are trading with a negative tone, further endorsing the above stance. Key support is situated at the level, a breach below which might lead to increased selling pressure on the stock, paving way for the (last touched in February 2016) and levels. However, a lower Bollinger band crossover on the daily and weekly charts indicates at potential recovery in the stock. Key resistance is placed at the level, followed by the and levels. Technical Picks Dubai Islamic Insurance and Reinsurance Co Ekttitab Holding Company Drake & Scull International (20) on CloseSMAVG (100) on : Strength Index (RSI)(14)050100 Nov-16 Dec-16 Jan-17 Mar-17 Apr-17 May-17%K(9)%D(5) (20) on CloseSMAVG (100) on : Strength Index (RSI)(14)050100 Nov-16 Dec-16 Jan-17 Mar-17 Apr-17 May-17%K(9)%D(5) (20) on CloseSMAVG (100) on.
8 Strength Index (RSI)(14)050100 Nov-16 Dec-16 Jan-17 Mar-17 Apr-17 May-17%K(9)%D(5) 3 The stock traded with a strong bias on Thursday and ended at At present, the daily MACD is treading water just above its centreline accompanied by the RSI and stochastic oscillators trading with a positive tone reflects bullish momentum in the coming session. On the weekly chart, the momentum oscillators are tranquil above their midlines, further substantiating the above view. The key technical barrier is located at the level, followed by the and the daily upper Bollinger band (currently placed at ).
9 A sustained break above the latter might lead to acceleration to the upside. On the other hand, immediate support is placed at the level, followed by the and the daily lower Bollinger band (currently placed at ). A move back below the latter might trigger bearishness in the stock. The stock traded in the red on Thursday and finished at , after touching a low at As clearly seen on the weekly chart, the momentum oscillators are heading downwards, hinting the presence of bearish momentum in the coming week.
10 On the daily chart, the MACD is pointing south along with the RSI and stochastic placed near their oversold region, further validates the above stance. Key support to be watched is situated at the level, followed by the and levels. A move back below the latter might trigger a further acceleration to the downside. On the bright side, the key technical obstacle is placed at the level, followed by the and the 100day SMA (currently placed at ). A break above the latter might lead to positive momentum in the stock. After forming a bullish harami cross candlestick pattern on the daily chart 07 May, the stock advanced for the fourth straight session on Thursday and closed at , following a high at With a signal line crossover by the daily MACD from below and the RSI & stochastic indicators sharply moving upwards, the near-term technical scenario appears to be bullish.