Transcription of December 3, 2019 Key Features of OECD Programme for ...
1 National Institute for Educational Policy Research, Ministry of Education, Culture, Sports, Science and Technology December 3, 2019. Key Features of OECD Programme for International Student Assessment 2018. (PISA 2018). PISA 2018 Results in Brief <Regarding PISA 2018>. Since year 2000, the OECD Programme for International Student Assessment (PISA) has been implementing assessment in three domains, reading literacy, mathematics literacy, and science literacy (reading was the major domain in PISA 2018), to 15-year-old students who are at the end of compulsory education every three years. The mean score is designed to be able to be compared over the years. From the previous PISA 2015, the mode of assessment has changed to computer-based assessment (CBA). In Japan, students in the grade equivalent to the first year of upper secondary school participated to the assessment, and PISA 2018 was implemented during the period between June and August 2018.
2 <Results in Japan>. Three domains Students in Japan continued to be on the world top level in mathematics and science. The OECD analyzed that they have solidly maintained its high level in terms of a long-term trend since the start of the assessment. In reading literacy, Japan was located in a group of countries that scored better than the OECD average, but the mean score and ranking of Japan statistically significantly declined compared to the previous assessment. In terms of a long-term trend, the OECD analyzed that Japan was one of the countries among the "Flat" type that showed no statistically significant change. Reading items which low percentage of Japanese students gave correct answer were, for example, items locating information from a text and items assessing the quality and credibility of a text.
3 Students in Japan continue to have problem in explaining their own ideas using evidence so that other people can Reading understand, in open ended-response items in reading. According to the student questionnaire, students in Japan tend to have a positive view towards reading. For example, the percentage of students in Japan who answered "Reading is one of my favourite hobbies" was higher than the OECD average. In addition, such students tend to have higher score in reading. In Japan, just as in other OECD member countries, there was a tendency that the percentage of students with low Questionnaire level of proficiency is higher among students with a lower level of social, economic and cultural status. Regarding the students' use of ICT, the hours of its use in school lessons is shorter than other countries in Japan.
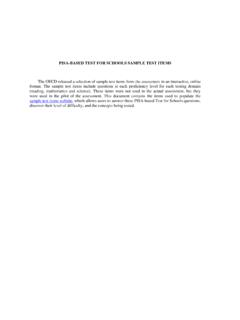
4 In addition, although students use ICT for various purposes outside of school, their use tends to be biased toward chatting and playing video games. (Mean score). Mean score Changes in mean scores and ranking Explanatory note Rank among OECD countries [Range of rank]. Shift to computer-based assessment (Year of PISA). *Score points were converted by setting the OECD average in the assessment, in which each domain became the major domain (domain on which the assessment is focused) for the first time (2000 for reading, 2003 for mathematics, and 2006 for science), as the standard value (500 score points). For mathematics and science, results from the assessment, for which results can be compared are described on the graph. The symbols for each results are shown in a larger format for the year in which the relevant domain was the major domain.
5 *Wave lines are drawn between 2012 and 2015 because the ways of scaling and scoring were changed in PISA 2015 with the shift to computer-based assessment. *The range of rank indicates Japan's range of upper and lower ranks among OECD countries in the mean score that are statistically plausible. 1. 1. PISA 2018 Results Countries surrounded by dotted lines are Comparison among OECD member countries (37 countries) those that have no statistically significant difference from Japan's mean score. Mean Mean Mean Reading Mathematics Science score score score 1 Estonia 523 Japan 527 Estonia 530. 2 Canada 520 Korea 526 Japan 529. 3 Finland 520 Estonia 523 Finland 522. 4 Ireland 518 Netherlands 519 Korea 519. 5 Korea 514 Poland 516 Canada 518. 6 Poland 512 Switzerland 515 Poland 511.
6 7 Sweden 506 Canada 512 New Zealand 508. 8 New Zealand 506 Denmark 509 Slovenia 507. 9 United States 505 Slovenia 509 United Kingdom 505. 10 United Kingdom 504 Belgium 508 Netherlands 503. 11 Japan 504 Finland 507 Germany 503. 12 Australia 503 Sweden 502 Austria 503. 13 Denmark 501 United Kingdom 502 United States 502. 14 Norway 499 Norway 501 Sweden 499. 15 Germany 498 Germany 500 Belgium 499. 16 Slovenia 495 Ireland 500 Czech Republic 497. 17 Belgium 493 Czech Republic 499 Ireland 496. 18 France 493 Austria 499 Switzerland 495. 19 Portugal 492 Latvia 496 France 493. 20 Czech Republic 490 France 495 Denmark 493. OECD average 487 OECD average 489 OECD average 489. Reliable interval* (Japan) 499-509 Reliable interval (Japan) 522-532 Reliable interval (Japan) 524-534.
7 Comparison among all participating countries and economies Countries surrounded by dotted lines are those that have no statistically significant (79 countries/economies) difference from Japan's mean score. Mean Mean Mean Reading Mathematics Science score score score Beijing/Shanghai/Jiang Beijing/Shanghai/Jiang Beijing/Shanghai/Jiang 1. su/Zhejiang 555 su/Zhejiang 591 su/Zhejiang 590. 2 Singapore 549 Singapore 569 Singapore 551. 3 Macau 525 Macau 558 Macau 544. 4 Hong Kong 524 Hong Kong 551 Estonia 530. 5 Estonia 523 Taiwan 531 Japan 529. 6 Canada 520 Japan 527 Finland 522. 7 Finland 520 Korea 526 Korea 519. 8 Ireland 518 Estonia 523 Canada 518. 9 Korea 514 Netherlands 519 Hong Kong 517. 10 Poland 512 Poland 516 Taiwan 516. 11 Sweden 506 Switzerland 515 Poland 511.
8 12 New Zealand 506 Canada 512 New Zealand 508. 13 United States 505 Denmark 509 Slovenia 507. 14 United Kingdom 504 Slovenia 509 United Kingdom 505. 15 Japan 504 Belgium 508 Netherlands 503. 16 Australia 503 Finland 507 Germany 503. 17 Taiwan 503 Sweden 502 Australia 503. 18 Denmark 501 United Kingdom 502 United States 502. 19 Norway 499 Norway 501 Sweden 499. 20 Germany 498 Germany 500 Belgium 499. Reliable interval* (Japan) 499-509 Reliable interval (Japan) 522-532 Reliable interval (Japan) 524-534. *Gray-colored countries/economies are non-OECD member countries/economies. *The reliable interval indicates the range of score points in which the mean value of all the students (population) subject to the assessment is considered to exist. As PISA is a sample survey, the mean value must be considered within a certain range.
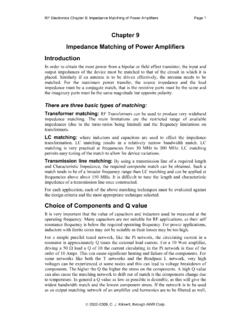
9 *Even countries with the same score points differ in the rank because their score points differ in decimal places. 2. 2. Reading Literacy Japan's results in reading literacy Japan's mean score in reading (504 score points) is among a group of countries that scored higher than the OECD. average, but it has statistically significantly declined from the previous PISA 2015 (516 score points). Ranked 11th among OECD member countries (range of rank: 7th to 15th). The share of low-scoring students who attained Level 1 proficiency or lower have statistically significantly increased, and the OECD average also shows the same tendency. * The higher the level of proficiency shows that, the student have attained a higher score points, and have sufficiently high proficiency in the relevant domain.
10 (%) Students who attained Level 6 proficiency or higher have been assessed since 2009, and such students were included in Level 5 before 2006. * Black dot in the graphs indicate OECD average. Level 1 or lower Level 2 Level 3 Level 4 Level 5 Level 6 or higher (Less than 408 (From 408 to less than 481 (From 481 to less than 553 (From 553 to less than 626 (From 626 to less than 698 (From 698. score points) score points) score points) score points) score points) score points). 2000 (522 score points) 2003 (498 score points) 2006 (498 score points) 2009 (520 score points) 2012 (538 score points) 2015 (516 score points) 2018 (504 score points). *Figures in parentheses are Japan's mean scores in reading. Long-term trend of the mean score of each country/economy According to the OECD analysis of the long-term trend of the mean scores between 2000 and 2018, Japan's reading performance is classified as countries/economies with no statistically significant change in average trend and falls under the "Flat" type among them.