Transcription of Description of indicators and method - OECD.org
1 3. SCIENCE AND INNOVATION: COUNTRY NOTESOECD SCIENCE, TECHNOLOGY AND INDUSTRY OUTLOOK 2008 ISBN 978-92-64-04991-8 OECD 2008176 annex Description of indicators and methodThe first graph for each country the radar graph illustrates the position of thecountry against the OECD average performance on a set of common indicators . Data fornon-OECD countries are not included in the average. The indicators were selected on thebasis of policy relevance, as well as availability of quality data for a majority of countries,in order to provide a broad snapshot of science and innovation performance. They focus onresearch and innovation inputs, scientific and innovation outputs, linkages and networks,including international linkages, and human resources. As an overview: Gross expenditure on R&D (GERD) as a percentage of GDP is the main aggregate used forinternational comparison of R&D expenditures, and represents a country s domesticR&D-related expenditure for a given year.
2 Business enterprise expenditure on R&D (BERD) as a percentage of GDP is an indicator of R&Dactivities carried out in the business sector by performing firms and institutes,regardless of the origin of funding. Industrial R&D is most closely linked to the creationof new products and production techniques, as well as to a country s innovation efforts. Venture capital as a percentage of GDP is a measure of one important source of funding fornew technology-based firms. Venture capital plays a crucial role in promoting the radicalinnovations often developed by such firms and is one of the decisive determinants ofentrepreneurship. Triadic patents per million population is an indicator of innovation outputs, adjusted toaccount for the size of the country. Triadic patents are a set of patents taken at theEuropean Patent Office, the Japan Patent Office and the US Patent and Trademark Officethat protect the same invention. The use of triadic patents as an indicator eliminates theproblems of home advantage and influence of geographical location that areencountered with single-office patent indicators and thus improves the internationalcomparability of the data.
3 Scientific articles per million population is an indicator often used to highlight the scientific productivity of countries and is an important measure of research output, sincepublication is the main means of disseminating and validating research results. Articlecounts are based on science and engineering* articles, notes and reviews published in aset of the world s most influential scientific and technical journals. Some caveatsregarding this indicator should be noted: the journals have good international coverage,although journals of regional or local importance may not be included; there is anEnglish-language bias; the propensity to publish differs across countries and fields ofstudy; and incentives to publish can lead to questions about quality.* Science and engineering includes life sciences, physical sciences, social and behavioural sciences,and computer SCIENCE AND INNOVATION: COUNTRY NOTESOECD SCIENCE, TECHNOLOGY AND INDUSTRY OUTLOOK 2008 ISBN 978-92-64-04991-8 OECD 2008177 Percentage of firms with new-to-market product innovations provides a measure of innovationand novelty.
4 Firms that first develop innovations can be considered as drivers of theprocess of innovation. Many new ideas and knowledge originate from these firms, withthe full economic impact of their innovations depending on their adoption by other firms. Percentage of firms undertaking non-technological innovation looks more closely at marketingand organisational innovations, which are an important dimension of many firms innovation activities and are particularly relevant for service firms. Percentage of innovative firms collaborating aims to highlight the extent of activeparticipation in joint innovation projects with other organisations. Collaboration is animportant part of the innovation activities of many firms, and can involve the jointdevelopment of new products, processes or other innovations with customers andsuppliers, as well as horizontal work with other enterprises or public research bodies.
5 Patents with foreign co-inventors is one measure of the internationalisation of research. Itconstitutes an indicator of formal R&D co-operation and knowledge exchange betweeninventors located in different countries, and highlights how institutions seekcompetencies or resources beyond their national borders. Percentage of GERD financed by abroad is another measure of internationalisation. Foreignfunding of R&D is an important source of financing for many countries. Researchers per 1 000 total employment measures one of the central human resourceelements of the research and development system. Researchers are professionalsengaged in the conception and creation of new knowledge, products, processes, methods and systems and are directly involved in the management of projects. Science and engineering degrees as a percentage of all new degrees is an indicator of a country spotential for assimilating, developing and diffusing advanced knowledge and supplyingthe labour market with human resources that possess critical skills for research anddevelopment.
6 HRST occupations as a percentage of total employment is an indicator of the extent ofinnovation-related skills in the workforce. This category of workers corresponds toprofessionals and technicians as defined in the International Standard Classification ofOccupations (ISCO-88).To construct the radar graphs, the raw data for each indicator (shown in Table annex ) was transformed into an index, with the country with the maximum valueof the indicator taking an index value of 100 and the other countries taking values belowthis as appropriate. For example, for the indicator on Gross expenditure on R&D (GERD) as apercentage of GDP, Israel was the country with the highest value ( ) and thus took theindex value of 100. Following the transformation of the raw data into indices, an OECD average for each indicator was obtained. This allowed the construction of an average valuefor each indicator (the dotted line in the radar graphs), against which individual countryresults were plotted (the solid line in the radar graphs).
7 3. SCIENCE AND INNOVATION: COUNTRY NOTESOECD SCIENCE, TECHNOLOGY AND INDUSTRY OUTLOOK 2008 ISBN 978-92-64-04991-8 OECD 2008178 The radar graph averages were calculated by taking into account all OECD countrieswith available data. Non-OECD countries were not included in the average. Table inAnnex indicates where data was unavailable for some countries. In some instances ofdata unavailability, alternative indicators were used, if these were considered to provide agood replacement. These alternative indicators are specified in Table For example,for the indicator on Venture capital as a percentage of GDP, the alternative indicatorIndustry-financed GERD as a percentage of GDP was used for Iceland, Luxembourg and calculate the radar indicator in this case, an index for Industry-financed GERD as apercentage of GDP was constructed, in the same manner as described above. The indexvalues yielded for Iceland, Luxembourg and Turkey were then used as an alternative forVenture capital as a percentage of SCIENCE AND INNOVATION.
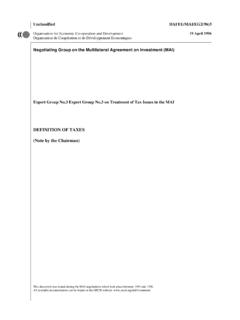
8 COUNTRY NOTESOECD SCIENCE, TECHNOLOGY AND INDUSTRY OUTLOOK 2008 ISBN 978-92-64-04991-8 OECD 2008179 Table graph indicators and values1 GERD as % of GDPBERD as % of GDPV enturecapital as% GDPT riadic patents permillion populationScientific articles permillion population% of firms with new-to-market product innovations (asa % of all firms) % of firms undertaking non-technological innovation (asa% of all firms) % of firms collaborating (as a % of all firms) Patents with foreign co-inventors% of GERD financed by abroadResearchers per1 000total employmentScience and engineering degrees as% of all new degreesHRST occupations as% of total employmentOECD ofservices inbusiness R&D ofservices inbusiness R&D GERD as % GDP patents 1995-2005 ofservices inbusiness R&D R&D inHE and GOV GERD as % GDP SCIENCE AND INNOVATION: COUNTRY NOTESOECD SCIENCE, TECHNOLOGY AND INDUSTRY OUTLOOK 2008 ISBN 978-92-64-04991-8 OECD patents Business-funded R&D inHE and GOV graduates intotal employment ofservices inbusiness R&D patents Business-funded R&D inHE and GOV GERD as a % of GDP patents 1995-2005 Business-funded R&D inHE and GOV graduates intotal employment ofservices inbusiness R&D patents ofservices inbusiness R&D R&D inHE and GOV expenditure of foreign affiliates as a % of R&D expenditure graph indicators and values1 (cont.)
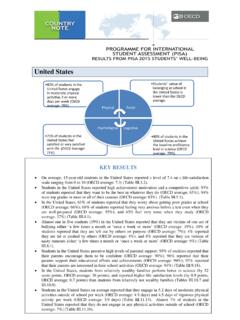
9 GERD as % of GDPBERD as % of GDPV enturecapital as% GDPT riadic patents permillion populationScientific articles permillion population% of firms with new-to-market product innovations (asa % of all firms) % of firms undertaking non-technological innovation (asa% of all firms) % of firms collaborating (as a % of all firms) Patents with foreign co-inventors% of GERD financed by abroadResearchers per1 000total employmentScience and engineering degrees as% of all new degreesHRST occupations as% of total employment3. SCIENCE AND INNOVATION: COUNTRY NOTESOECD SCIENCE, TECHNOLOGY AND INDUSTRY OUTLOOK 2008 ISBN 978-92-64-04991-8 OECD 2008181 Non-OECD 25-64 with tertiary degree 25-64 with tertiary degree 25-64 with tertiary degree 25-64 with tertiary degree of collaborating firms refers to innovators only 25-64 with tertiary degree Note:The table shows actual indicator values. For each indicator in the radar graph, the country with the maximum value is set at 100 and the average is calculated by taking into accountall OECD countries with available See Table for precise graph indicators and values1 (cont.)
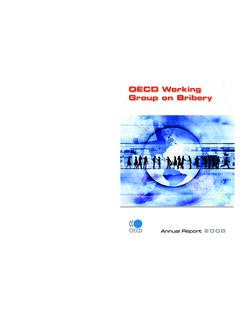
10 GERD as % of GDPBERD as % of GDPV enturecapital as% GDPT riadic patents permillion populationScientific articles permillion population% of firms with new-to-market product innovations (asa % of all firms) % of firms undertaking non-technological innovation (asa% of all firms) % of firms collaborating (as a % of all firms) Patents with foreign co-inventors% of GERD financed by abroadResearchers per1 000total employmentScience and engineering degrees as% of all new degreesHRST occupations as% of total employment3. SCIENCE AND INNOVATION: COUNTRY NOTESOECD SCIENCE, TECHNOLOGY AND INDUSTRY OUTLOOK 2008 ISBN 978-92-64-04991-8 OECD 2008182 Table graph country data notesGERD as % of GDP2006 BERD as % of GDP2006 Venturecapitalas % GDP2006 Triadic patents permillion population 2005 Scientific articles permillion population 2003% of firms with new-to-market product innovations (asa % of all firms) 2002-04% of firms undertaking non-technological innovation (asa % of all firms) 2002-04% of firms collaborating (as a % of all firms)