Transcription of Designing Reports in Access - University of Illinois at ...
1 [Not for Circulation] Information Technology Services, UIS 1 Designing Reports in Access This document provides basic techniques for Designing Reports in Microsoft Access . Opening Comments about Reports Reports are a great way to organize and present data from your Access database. Reports enable you to format your data in an attractive and informative layout for printing or viewing on screen. Reports are often used to present a big-picture overview, highlighting main facts and trends. The data in a preview or in a printed report is static.
2 Reports merely present the data; they do not alter the underlying data in the tables. Each time a report is opened, Access displays the most recent data. Creating a report Reports are created from one or more tables or queries. To use several tables, you would first create a query to retrieve data from those tables. There are three basic ways to create a report : with a single mouse click, with the report wizard, or in Design view. To create a report with a single click, 1. Open the table or query upon which you want to base the report .
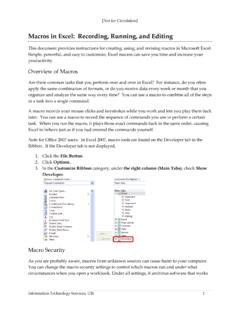
3 2. On the Create tab, click report . 3. The report is created and displays all the fields from the underlying table or query. The report tool may not create the final, polished product that you ultimately want, but it is quite useful as a means to quickly look at the underlying data. You can then save the report and modify it in Layout view or Design view so that it better serves your purposes. [Not for Circulation] Information Technology Services, UIS 2 You can use the report Wizard to be more selective about what fields appear on your report .
4 You can also specify how the data is grouped and sorted, and you can use fields from more than one table or query, provided you have specified the relationships between the tables and queries beforehand. The report Wizard asks you questions and creates a report based on your answers. This method is best when you want to be stepped through the process of creating a report . To create a report using the wizard, 1. On the Create tab, click report Wizard. 2. Follow the onscreen prompts. 3. Additional customization can be done in Design or Layout view.
5 Design view gives you total freedom and control, right from the beginning. Controls can be bound to data from your database, displaying it directly, or they can be unbound, without a link to a data source (such as descriptive text, dividing lines, a logo, etc). To create a report in Design view, 1. On the Create tab, click report Design. 2. Click on the Add Existing Fields button, on the Design tab, to see a list of tables/fields. [Not for Circulation] Information Technology Services, UIS 3 3. Drag or double-click fields to add them to the grid, as desired.
6 4. You can also create a report from scratch in Layout view instead of Design view. (Layout view is new to Access 2007.) From the Create tab, click Blank report . Customizing Reports Regardless of what method is used to create the report , Design view is where you add sections, group data, set report properties to control appearance and behavior, resize parts of a report , or change report formatting. Creating a report in Layout view allows you to see the actual data as the fields are added. Drag or double-click the desired fields from the Field List onto the report .
7 [Not for Circulation] Information Technology Services, UIS 4 Reports have three types of sections: Header: The report header appears only once, at the beginning of the report . The topmost contents of the report (such as company name, address, and logo) belong in the report header. The page header appears on every page of the report . Contents that you want to appear at the top of each page, such as column names, belong in the page header. Detail: The detail section contains most of the information in a report .
8 Footer: The page footer appears on every page. The report footer appears once, at the end of a report . The page footer section may contain the page number; the report footer section may contain the conclusion, such as a grand total. When you print a report , you usually want to organize the records in a particular order. For example, if you are printing a list of suppliers, you might want to sort the records alphabetically by company name. For many Reports , you may also want to divide them into groups.
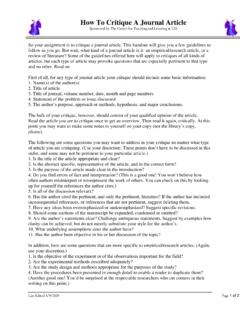
9 Grouping allows you to separate groups of records visually and to display introductory and summary data for each group. The report Wizard prompts you to add groups or sort order. However, grouping and sorting can also be added later. For example, 1. Let s start with this basic report listing order information. [Not for Circulation] Information Technology Services, UIS 5 2. To group the order listing by order ID, click on the Group & Sort button on the Design tab. This adds a Group, Sort, and Total pane at the bottom of the window.
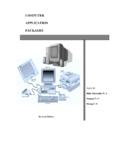
10 3. Click the Add a group button. Select the field upon which you want to group, then select a sort order. 4. Click the More button for more detailed options. 5. Additional groups/sorts can be added. They can also be prioritized or deleted by using the arrow or X buttons. [Not for Circulation] Information Technology Services, UIS 6 6. The resulting report looks like this: 7. To start a new page for each group, return to Design view and open the property sheet for the group. On the Format tab, set Force New Page to the desired location.