Transcription of DETECTING THE FAULT FROM SPECTROGRAMS BY …
1 AUTEX Research Journal, Vol. 7, No2, June 2007 AUTEX. DETECTING THE FAULT FROM SPECTROGRAMS BY USING. GENETIC ALGORITHM TECHNIQUES. Amin A. , El-Geheni A. , and El-Hawary I. A**. El-Beali R. 1. Mansoura University, Textile Department 2. Prof. Dr. Alexandria University, Textile Department 3. Prof. Dr. Mansoura University, Textile Department Abstract: During the last thirty years there has been a rapidly growing interest in the field of genetic algorithms (GAs). The field is at a stage of tremendous growth, as evidenced by the increasing number of conferences, workshops, and papers concerning it, as well as the emergence of a central journal for the field.
2 With their great robustness, genetic algorithms have proven to be a promising technique for many optimisation, design, control, and machine learning applications. This paper presents a new technique for DETECTING the source of FAULT in spinning mills from SPECTROGRAMS by using genetic algorithm. Key words: Textile spectrogram, genetic algorithm 1. Introduction The problem of faults and defects produced during the mechanical spinning of yarns is as old as the industry itself. In earlier times, much skill and experience were required in order to detect and remove these faults.
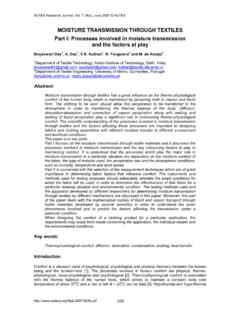
3 In this paper, an attempt is made at providing a key to enable the source of faults to be located. It is understood that only the more common defects can be covered here, since there is no end to the list of possible reasons. In any event, there is no complete replacement for skill and experience. An important point to be borne in mind is: - that machines generally create short term variations, and - that when ultimately drafted, these appear as long-term or count variations. Figure 1 illustrates the types of FAULT in the spinning mill. Detects in cotton spinning periodical non-periodical Distance between the Waves peaks in variations over 2 yds spectrogram faulty drafts.
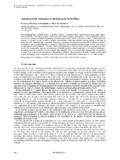
4 Sliver feed Hills in cleanliness of spectrogram machine Repeating high and low peaks in chart Distance between the variations under 2 yds Figure 1. Chart illustrating types of FAULT . 80. AUTEX Research Journal, Vol. 7, No2, June 2007 AUTEX. 2. Wavelength range of machine's faults [1]. Table 1 ( and ) presents a specification of machine elements and machine sets at which faults may occur, together with the dimensions and formulas related, as well as their positions at the SPECTROGRAMS . Table Machine parts, schematic drawings and dimensions specification.
5 Geometrical arrangement of the Specification of dimensions and Machine part particular machine elements end sets other parameters do D1 D2. df df = front roller diameter. do = outer diameter of bobbin. di = inner diameter of bobbin. dT = traveller diameter. Ring spinning D1= front draft. D2= back draft. l1 = length of top apron. di l2 = length of bottom apron. d df D1. D2. df df = front roller diameter. do = outer diameter of bobbin. di = inner diameter o bobbin. dT = traveller diameter. Speed frame D1= front draft. D2= back draft. di l1 = length of top apron.
6 L2 = length of bottom apron. d 6 1,2 = front roller diameter. 1. 3,4,5 = middle roller diameter. Draw frame 2 4 5 7 6,7= back roller diameter. D1= front draft. D1 D2. D2= back draft. 1,2 = front roller diameter. 1 3 5 7 3,4 = middle roller diameter. D1 D2 5,6 = back roller diameter. Comber 2 4 6 8 7,8 = detaching roller diameter. D1= front draft. D2= back draft. 4. 1 = licker-in diameter. 2= cylinder diameter. Card 2 3 = doffer diameter. 4 = lifting-of of flats. 5 1 5 = calender roller diameter. 3. 81. AUTEX Research Journal, Vol. 7, No2, June 2007 AUTEX.
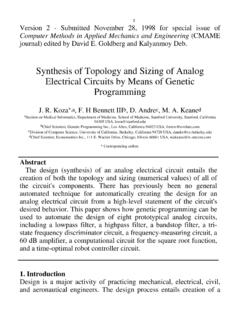
7 Table Machine parts, formulations of wavelengths and positions at the SPECTROGRAMS . Machine Source Calculation of wave length Front roller 1=d1* . Middle roller 2=d1* *D1. Back roller 3=d1* *Dtotal Top apron 4=l1*D1. Bottom apron Ring Drawbox drive 5=l2*D1. Spinning Ring traveller 6 shorter than 3. Empty spindle 7=dT* . Full spindle 8=di* . Drafting waves 9=do* . 10~ *l Front roller 1= d1* . Middle roller 2= d1* *D1. Back roller 3= d1* *Dtotal Top apron 4=l1*D1. Speed Bottom apron Frame Drawbox drive 5=l2*D1. Empty spindle 6 shorter than 3. Full spindle 7=d*.
8 Drafting waves 8=d* . 9~ *l Front roller 1= d1* . Front roller 2= d2 * . Middle roller 3= d1* *D1. Middle roller 4,5=d* *D1. Draw Frame II/I Back roller Back roller 6=d* *Dtotal Drawbox drive 7=d* *Dtotal Drafting waves 8 shorter than 6. 9~4*l Front roller 1,2=d1,2* . Middle roller 3,5,6=d3,4,5* *D1. Middle roller 4=d4* *D1. Comber Back roller 7,8=d* * Dtotal Drawbox drive Drafting waves 9 shorter than 6. 10~4*l d1 * * Vp Licker-in 1 =. d1 * * Vp d * * Vp Cylinder 2 = 2. d 2 * * Vp Doffer d * * Vp Card 3 = 3. d3 * * Vp Card flats l * Vp 4 =. l * n4.
9 Calender rollers 5 = d5 * . 82. AUTEX Research Journal, Vol. 7, No2, June 2007 AUTEX. 3. Genetic algorithms (GA). A genetic algorithm (GA) is a probabilistic search and optimisation technique based on the principles of biological evolution, natural selection, and genetic recombination, simulating the survival of the fittest in a population of potential solutions of individuals. GAs are capable of globally exploring a solution space, pursuing potentially fruitful paths while also examining random points to reduce the likelihood of settling for a local optimum [Goldberg, 1989].
10 They are conceptually simple yet computationally powerful, making them attractive for use in complex domains, and have been demonstrated on a wide variety of problems. GAs and evolutionary computation, which use the twin metaphors of natural evolution and survival of the fittest, derive their strength by working on populations of solutions and are therefore best exploited in a parallel computing environment. GAs function by iteratively refining a population of encoded representations of solutions. Parents' from a population are selected' for crossover' and mutation'.