Transcription of determining sample power - povertyactionlab.org
1 S ix rules of thum b for de ter m ining s a m ple s ize a nd s tatis tic a l pow er the abdul l atif ja meel povert y action l ab ( j - pal ). six rules of thumb for deter mining s a m p l e s i z e a n d s tat i s t i c a l p ow e r sum m a ry : The ability of an evaluation to detect a meaningful impact of a program is determined by the evaluation's sample size and statistical power . This is a tool for policymakers and practitioners that describes some of the factors that affect statistical power and sample size. Further information on the dangers of running an evaluation with inadequate power can be found in a companion resource available here. wh at is s tatistic a l powe r , a nd wh at is the pur pose of s tatistic a l powe r a n a lysis ? The statistical power , or power , of an evaluation reflects the likelihood of detecting any meaningful changes in an outcome of interest brought about by a successful program. In the process of designing a randomized evaluation, researchers conduct power analyses to inform decisions such as: Whether to conduct the evaluation At which unit to randomize ( , individual, household, or group).
2 How many units to randomize How many units or individuals to survey How many times to survey each unit or individual over the course of the evaluation How many different program alternatives to test How much baseline information to collect Which outcomes to measure How to measure the outcomes of interest It is important to understand how the factors above are interrelated and affect the overall power and sample size needed for a randomized evaluation. The rules of thumb outline the key relationships between the determinants of statistical power and sample size, and demonstrate how to design a high-powered randomized evaluation. cover photo: anton gvozdikov | shutterstock .com p ove r t y a c t i o n l a r g /n a 2. six rules of thumb for deter mining s a m p l e s i z e a n d s tat i s t i c a l p ow e r Rule of Thumb #1: 4. A larger sample increases the statistical power of the evaluation. Rule of Thumb #2: 4. If the effect size of a program is small, the evaluation needs a larger sample to achieve a given level of power .
3 Rule of Thumb #3: 5. An evaluation of a program with low take-up needs a larger sample . Rule of Thumb #4: 6. If the underlying population has high variation in outcomes, the evaluation needs a larger sample . Rule of Thumb #5: 7. For a given sample size, power is maximized when the sample is equally split between the treatment and control group. Rule of Thumb #6: 8. For a given sample size, randomizing at the cluster level as opposed to the individual level reduces the power of the evaluation. The more similar the outcomes of individuals within clusters are, the larger the sample needs to be. p ove r t y a c t i o n l a r g /n a 3. rule of thum b #1: a l a rge r sa m ple rule of thum b #2 : if the e ffec t size incr e a ses the s tatistic a l powe r of of a progr a m is sm a ll , the e va luation the e va luation ne e ds a l a rge r sa m ple to achie v e a giv e n le v e l of powe r Researchers run evaluations on samples that are selected from a larger population. When designing an evaluation, The effect size of an intervention is the magnitude of the research team must determine the number of the impact of the intervention on a particular outcome participants to include in the sample .
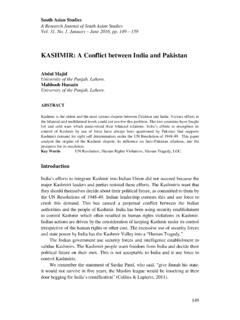
4 Of interest. When designing an evaluation, the research team wants to ensure that they are able to identify the In the extreme scenario, a researcher would be able to effect of the program with precision. When an evaluation include the whole population of interest in the study has sufficient power , impact estimates are precise. Both sample . In this case, the sample is the population and the effect size and sample size affect precision. is therefore the best representation of the population. However, in most cases, the study sample is a subset We can think about precision by thinking about the of the broader population. confidence with which images can be identified based on their size. Imagine that you are looking at the images Larger samples are more likely to be representative of in Figure through a camera lens. Which one can you the original population (see Figure ) and are more more precisely identify as a female? Is the image on the likely to capture impacts that would occur in the right the same as the image on the left?
5 Population. Additionally, larger samples increase the precision of impact estimates and the statistical power figure of the evaluation. When designing an evaluation, it is important to take 1x into account expected levels of attrition, since attrition reduces sample size and power . If you anticipate that you will not be able to collect outcome data on some study participants, increase your initial sample size to ensure that you will have sufficient power to detect the impact of the program at the conclusion of the intervention. Zooming in, we see that the image on the right is different from the image on the left. This difference is figure easier to identify when we increased our zoom. Large population images can be precisely identified without much zoom, while smaller images require more zoom. figure 5x Small sample Medium sample Large sample Lower power Higher power p ove r t y a c t i o n l a r g /n a 4. The size of the images represents the effect size, and the figure level of zoom represents the sample size of the evaluation.
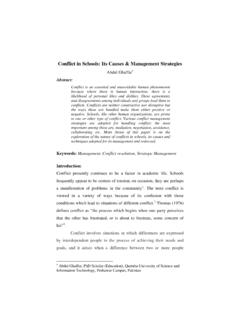
6 For a given level of power , large effects can be precisely detected with a smaller sample size, while smaller effects can only be precisely detected with larger sample sizes. Think of a larger sample as allowing you to zoom in on a smaller effect size, or image. A larger image requires effect size *. less zoom, or a smaller sample . A smaller image requires more zoom, or a larger sample . ( 100 + 100 +4 100 + 100 ) ( 0 ) = $100. 4. Treatment Control Enroll in program ($100 in savings). rule of thum b #3 : a n e va luation of a progr a m with low ta k e - up ne e ds * , average difference between treatment and control a l a rge r sa m ple Randomized evaluations are designed to detect the figure average effect of a program over the entire sample that is assigned to the treatment group. Therefore, lower take-up decreases the magnitude of the average effect of the program. Since a larger sample is required to detect a smaller effect (see rule of thumb #2), it is important to plan ahead if low take-up is anticipated and run the evaluation with a larger sample .
7 Effect size *. To illustrate the relationship between take-up, effect ( 100 + 0 +4 100 + 0 ) ( 0 ) = $50. 4. size, and sample size, consider this simplified example: Treatment Control Enroll in program four households are randomly selected to receive ($100 in savings). encouragement to enroll in a program, and four * , average difference between treatment and control do not receive encouragement to enroll. Once a household enrolls and participates, the program is expected to increase savings by $100 for each household that If, as in Figure , 100 percent of the treatment group enrolls in the program, the average effect of the program, or the effect size, is $100. If, as in Figure , only 50 percent of the treatment group enrolls in the program, the effect size is $50. 1. We use eight households purely for illustrative purposes; an actual evaluation would need many more households to have sufficient statistical power . p ove r t y a c t i o n l a r g /n a 5. rule of thum b #4 : if the unde r lying others have a low BMI.
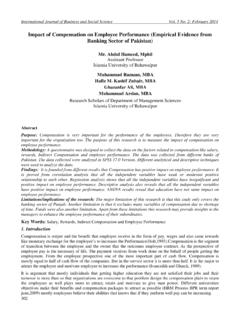
8 Absent the program and randomized popul ation h a s high va r i ation in evaluation, over a given period of time, the BMI for the outcom es , the e va luation ne e ds a sample might change due to naturally occurring variation l a rge r sa m ple within the population. Say a nutrition and exercise program is implemented When the program is administered to the randomly- in schools to decrease the rate of childhood obesity. selected treatment group, you might observe that the First, consider a scenario in which there is no variation BMI in the treatment group drops (Figure ), but since in the incidence of obesity as measured by Body Mass BMI varies within the population, it is more challenging Index (BMI); each student has the same BMI. Absent to attribute this change in BMI to the program rather the program and absent a randomized evaluation, if you than to the natural variation in BMI within the sample . observe the average BMI for the entire group over a given period of time, you would expect to see little change in If the evaluation is conducted on this high-variance sample , BMI for the entire group.
9 We still do not know whether the nutrition and exercise program caused the average BMI in the treatment group If you conducted a randomized evaluation, and introduced to fall, or whether the change in average BMI of the the program to the randomly-selected treatment group, treatment group is due to naturally occurring variation you might see that the BMI in the treatment group drops that was present before the program was introduced. (Figure ). In this case, you can be confident that this effect can be attributed to the program. In a population with high variation in key outcome measures ( , BMI), it is challenging to disentangle the Alternatively, consider a scenario in which there is high effect of the program from the effect of random variation variation in the incidence of obesity as measured by Body in these outcome measures. Mass Index (BMI); some students have a high BMI and Especially when running an evaluation on a population figure with high variance, selecting a larger sample increases the likelihood that you will be able to distinguish the Low variation in BMI.
10 Impact of the program from the impact of naturally occurring variation in key outcome measures. Larger Treatment samples in the presence of high variance make it easier to identify the causal impact of a program (Figure ). Control figure Low Population Variance High figure High variation in BMI. Treatment Control Key for Figure and : Low BMI High BMI Smaller sample Size Needed Larger p ove r t y a c t i o n l a r g /n a 6. rule of thum b #5 : for a giv e n sa m ple A research team might design their study in this way size , powe r is m a xi m ize d whe n the sa m ple so that they can examine the pooled impact of both is equa lly split b e t we e n the tr e atm e nt a nd treatments compared to the control condition. With control group a large sample , this allocation strategy also equips researchers to compare the impact of the job-only To achieve maximum power for a given sample size, the treatment to the job and career coach treatment. sample should be evenly divided between the treatment However, since the sample is cut in half to compare group and control group.