Transcription of Outcomes, indicators, and measuring impact
1 TRANSLATING RESEARCH INTO ACTIONO utcomes, indicators, and measuring impactEsther Duflo Professor of Why evaluate? What is evaluation?2. Outcomes, indicators and measuring impact3. impact evaluation why randomize4. How to randomize5. Sampling and Sample Size6. Analysis and inference7. RCTs: Start to FinishCourse Overview1. Why evaluate? What is evaluation?2. Outcomes, indicators and measuring impact3. impact evaluation why randomize4. How to randomize5. Sampling and Sample Size6. Analysis and inference7. RCTs: Start to FinishCourse Overview Identifying problems/constraints that might help us choose among possible interventions/experiment Describing the environment within which the intervention/experiment takes place measuring the inputs into the intervention Assessing the implementation of the intervention measuring the outcomes/ impact of the interventionGoals of measurement4 Outcomes and indicators Logical Model Data CollectionLecture Overview5 Outcomes and indicators Intended goals Unintended consequences Possible outcomes and indicators Logical Model Data CollectionLecture Overview6 The setting.
2 Quotas in the Village Councils7 What are the main goals of the Village Council? What are the main characteristics of the quota policy? The setting: Quotas in the Village Councils8 Why were quotas deemed to be desirable in this context? Why did some people doubt that quotas would be effective? The controversy about quotas9 Let s start by drawing a list of everything we think quotas for women may affect. The possible effects10 Define key hypotheses before the beginning of the experiment Suppose that you collect data on 20 different outcomes You find one is significantly positive You find one is significantly negative You find that for 18, the outcomes are very similar, and not significantly different What can you conclude?
3 11 Multiple (primary/final) outcomes What might be examples of a few key hypotheses to test? Which variables, or combinations of variables, might you use to test these key hypotheses?Defining key hypotheses12 Outcomes and indicators Logical Model Key hypotheses and chain of causality Hints on data collection Data CollectionLecture Overview13 We want to answer more than: how effective is the intervention? We also want to answer: why it is effective? We want to draw the linkinputs intermediary outcomes primary outcome What are the intermediate outcomes through which the intervention is affecting the final outcome of interest?
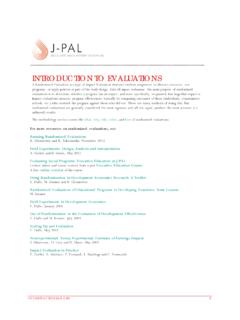
4 How are they likely to be affected? Drawing the chain of causality14 Defining and measuring intermediate outcomes will enrich our understanding of the program, reinforce our conclusions, and make it easier to draw general lessons What are the possible chains of outcomes in the case of the quotas? What are the critical steps needed to obtain the final results? What variables should we try to obtain at every step of the way to discriminate between various models? Modeling the effects of quotas15A theory of DemocracySome democracyPradhan s preferences matterMore womenPradhansWomen are empoweredWomen have differentpreferencesPublic goods reflectwomen s preferenceDifferentPublic goodsDifferent health, educationOutcomes?
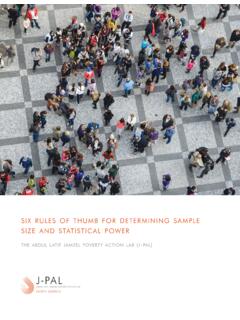
5 16 NeedsInput Output outcome impact (primary outcome )Long-termGoalWomen have poor health and low levels of education. Their needs are not represented in local government Reserved seats for women leadersMore local women leadersWomen more engaged and more directly involved in political decision makingDifferent public goods. Better education and health outcomesGender equality in health, education. Quotas no longer necessary?INDICATORS:Gender of leaderBudget allocations attendance in council level. BMI for girls, with indicators: quotas for local women leaders Outcomes and indicators Logical Model Data Collection In practice Data Entry EthicsLecture Overview18 ToolTarget Respondent Target OutcomesGP InterviewVillageLeaderoPradhan s background (socioeconomic status, education)oPolitical ambitionsoPolitical experienceoInvestments undertaken oPublic records.
6 Such as GP balance sheetsTranscript of Gram Sabha GPoWho speaks and when (gender)oFor how long do they speak?oWhat issues do they raise?Data collected in panchayat studyToolTarget Respondent Target OutcomesVillage Participatory Resource Appraisal (village mapping exercise and focus groups)10 to 20 villagers per villageoVillage infrastructure (schools, roads, wells, SC and ST areas, cultivated land, irrigation, energy projects)Perception of quality of different public goodsParticipation of men and women in activitiesWhat issues villagers have raised with GPHousehold interviewsHead of household (the male in some HH; the female in other HH) oHH demographic and socioeconomic dataHH outcomes (child heath, measurement of height and weight, etc.)
7 HH perceptions of quality of public goods and servicesDeclared HH preferencesData collected in panchayat studyToolTarget Respondent Target OutcomesExisting administrative data Public data archives (national, GP, and Village)oA snapshot of village characteristics population, public goods, demographics, etc. at the time of the 1991 and 2001 census oExpenditures on public goods and services in GP (from GP balance sheets) oIssues addressed at GP public assemblies (from Gram Sabhaminutes)Data collected in panchayat study To get the data on the variables that you are interested in To get adequate coverage of the treated (and control) population To get coverage of the treated population at the appropriate timeWhy collect your own data?
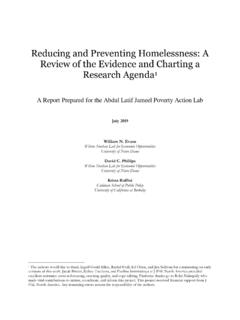
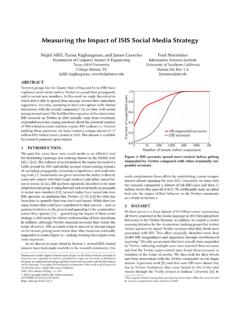
8 Why not collect field data?A surveyor in Udaipur, India, searches for a respondent Time consuming, risky, drawn out process High turnover of civil servants may lose your advocate in an office/ministry may lose permission to do research Survey company fails to honor contract Poor data quality and need to return to field Natural/human disasters Lots of managementWhy not collect field data? Treatment vs comparison endline is unbiased, so consider putting budget into larger sample May or may not be confident of randomization without baseline Baseline allows controls for baseline characteristics, especially lagged value of outcome of interest Other covariates could potentially soak up variation, but usually not much Baseline allows interactions Administrative data for baseline?
9 For endline? Should you do a baseline? Outcomes for educational interventions seem to change over time Multiple waves of measurement Results at one stage can help in securing funding for later stages Increased precisions Collect data at each stage to help find respondents laterWhen to do the endline Financial resources tradeoff between sample size and amount of information obtained from each household Human resource capacity of organization implementing the survey research coordinators, interviewers, data entry staff Willingness and ability of respondents to provide desired information For example, some people may not know how old they are.
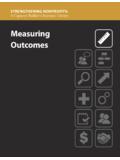
10 Consider constraints Willingness to provide desired information: Use objective measures if treatment or act of measurement may influence measurement Ability to provide information: Perceptions vs. realityRespondent willingness and ability If sampling a larger target population, you will want a household level census Data entry format must be clear and should not leave room for interpretation by the collection, I Contracting out vs. employing enumerators directly? Training enumerators in these procedures is essential. Create manuals for all survey collection, IINew surveyors learning to use health equipment in Udaipur, India.