Transcription of Development of 5-MW Downwind Turbine and …
1 938 Hitachi Review Vol. 65 (2016), No. 4- 48 -Featured ArticlesDevelopment of 5-MW Downwind Turbine and floating Substation facility for offshore Wind PowerSoichiro KiyokiKiyoshi Sakamoto, Dr. Inamura, Dr. TobinagaMitsuru SaekiKazutaka YokoyamaOVERVIEW: To meet the societal demand for greater use of renewable energy, Hitachi is working on developing equipment that can be used in offshore wind farms. In terms of wind turbines, up to now Hitachi has developed 2-MW Downwind turbines, and it is drawing on this experience to develop a more reliable 5-MW Downwind Turbine . A prototype Turbine is currently being moved into commercial operation. This article describes the performance/function testing carried out during trial operation, and the test results. Since Japan has few areas of shallow coastal water, floating offshore wind farms are promising, so this article also describes the Development of the floating substation facilities these wind farms will fuel depletion, global warming, and concern for the energy mix are resulting in rising societal demand for renewable energy sources.
2 Wind power is one of the more cost-competitive renewables, and its use is being promoted worldwide. offshore wind farms offer benefits such as a reduction in land-based sites, high or stable wind speeds, and low incidence of environmental problems such as noise. Many such sites are being planned inside and outside of has developed wind turbines to meet the societal demand for renewables. It installed a 2-MW Downwind Turbine prototype (model ) in 2005, with 96 units of this model installed in Japan so far. In 2010, Hitachi installed seven units of the same model in the open ocean (a first in Japan), and added eight more units in 2013. Also in 2013, the company installed a floating offshore wind Turbine off the coast of Nagasaki, and another off the coast of Fukushima(1). These facilities are the first of their kind in Japan, and only the third of their kind worldwide.
3 Hitachi is currently developing a more cost-effective 5-MW Downwind Turbine (model ). A prototype Turbine was constructed in March 2015 on coastal land in Kamisu, Ibaraki Prefecture, and began commercial operation in September 2015. The Development concept(1) and Development process(2) have been discussed in previous articles. This article will discuss the performance/function testing done on the prototype Japan has few areas of shallow coastal water, floating wind turbines and substations are needed. The Development of the world s first floating offshore substation is discussed : BASIC SPECIFICATIONS, FEATURESTo withstand the typhoons that strike Japan and neighboring regions, the was designed for an extreme wind speed of 55 m/s, in excess of the Class I standard specified by the International Electrotechnical Commission (IEC).
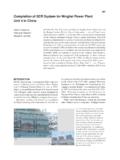
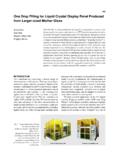
4 Drawing Rated output5,000 kWRotor diameter126 mNumber of blades3 Rotor orientationDownwindTilt angle 8 degOutput controlPitch, variable speedsConing angle5 degExtreme wind speed55 m/sAverage wind speed10 m/sTurbulence categoryASpeedup ratio1:40 (approx.)GeneratorPermanent magnet synchronous generatorPower conditioning system (PCS)Full converterTABLE 1. Basic SpecificationsAn output voltage of 33 kV was selected due to the cost effectiveness of using undersea cable for connecting to the land-based Review Vol. 65 (2016), No. 4 939 - 49 -on Hitachi s previous wind Turbine Development experience, a Downwind Turbine rotor position was selected, providing superior performance during power failures in high winds and ensuring easy tower clearance. Table 1 lists the basic specifications of the , and Fig. 1 shows a photograph of increase reliability, the unit s structure features a medium-speed gear drive system, a shaft driven by dual-bearing outer ring drive, and passive cooling TRIAL OPERATIONP ower Generation Performance TestingIn the vicinity of the prototype Turbine , Hitachi has installed a wind mast at the same 90-m height as the wind Turbine s hub, and is evaluating the power curve.
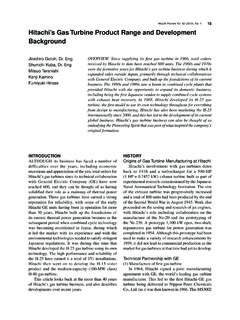
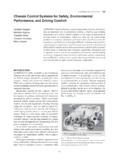
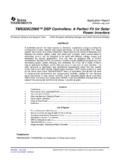
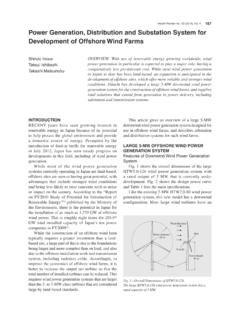
5 Fig. 2 shows an aerial photograph of the site, and the side view of the wind mast. The wind mast is installed about 300 m west-southwest of the wind Turbine , wind speed and the wind direction height distribution, air pressure, temperature, and humidity are being 3 shows the measured power curve. Since there are pylons belonging to the Kashima Thermal power Station (owned by the Tokyo Electric power Co., Inc.) located on the south side of the wind Turbine , the data for the southern wind direction has been omitted from the analysis. Although the wind Turbine s method of operation is currently being adjusted, Fig. 1 Photograph of the Prototype prototype Turbine was installed in March 2015 in Kamisu, Ibaraki Prefecture, and is undergoing various types of performance/function ,0002,0003,0004,0005,0006,000 power (kW)Wind speed (m/s)Measured values for 10 minCatalog valuesFig.
6 3 Measured power Curve curve shows the correlation between the power and the wind speed measured by the wind mast at the height of the wind Turbine hub. The performance obtained closely resembles the anticipated catalog vane installation heights30 Pylon heights(including lightning rods)Branch line installation height45,000 Ground line30,00060,00090,00063,00084,00093,000 2,5006,3009,0009,0009,0009,0009,0009,000 9,0009,0008,70089,50087,00088,5005,000 5,000 Wind mastAbout 300 mPylons of Kashima Thermal power Station (Tokyo Electric power Co., Inc.) 2 Aerial Photograph of the Prototype Turbine Site and Side View of the Wind determine the prototype Turbine s generation performance, a wind mast was constructed near it to measure parameters such as wind speed. The aerial photograph of the prototype Turbine site is from Google Maps* (3).* Google Maps is a trademark of Google Development of 5-MW Downwind Turbine and floating Substation facility for offshore Wind power - 50 -Hitachi has verified that performance similar to the expected values can be of Continuous Operation during Grid FaultsThe Downwind wind power generation system comes with an fault ride through (FRT) function provided as a standard feature.
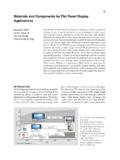
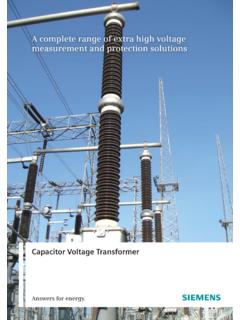
7 When an instantaneous voltage drop occurs due to a grid fault, the FRT function allows the system to continue operating without taking the Turbine offline as long as the grid voltage drop level and voltage drop time are within the specified ranges. Factory testing of a combination of the generator and power conditioning system (PCS) has verified that this function meets the specification requirements. Fig. 4 shows the factory test configuration. The FRT circuit simulates a voltage drop during a grid fault. Fig. 5 shows an example factory test waveform. Hitachi has verified that the generation output was covered within the time specified by the Japanese standard(4) after the grid voltage was is also conducting grid fault continuous operation testing on the prototype Turbine . This verification testing is done by inserting an FRT circuit between the wind Turbine and the network substation used for connecting to the power company, and checking the behavior of the entire wind power generation system.
8 It is scheduled to be completed within Performance TestingTo cool the nacelle and tower, the uses a passive cooling system that has no fan for the radiator. Computational fluid dynamics was used to design the nacelle shape and radiator placement to obtain the air flow needed for the nacelle cooling system and tower cooling system during operation of the prototype Turbine under load, Fig. 6 shows the correlation between the temperature of the cooling water (relative to the outside air) after passing through the radiator and the nacelle wind speed. The diagram shows that the cooling water temperature is low when the nacelle wind speed is high, resulting in higher cooling efficiency, and verifying the validity of the cooling system Evaluation TestingWhen designing the wind Turbine , the loads on various Turbine parts and cross-sections were calculated using aeroelastic analysis.
9 These loads were used as input conditions to evaluate strength by calculating stresses on detailed models using methods such as the finite element method (FEM). Verifying upstream loads is important when evaluating the structural soundness of wind turbines(5).The loads on the wind Turbine parts are currently being verified. The results of verification of the flapwise bending moment ( flap bend ) on the blade roots are presented here. Measurement was done using strain gauges installed on the positive and negative pressure sides in the flapwise. The difference between the two measurements was divided by 2 to remove Powersource #1 Powersource #2 Step-uptransformerTest generator(PMG)FRT circuitTest motorGenerator and PCS combination test benchPCSFig. 4 Factory Testing Configuration (FRT Function Verification).The generator to be tested was driven by a test motor, and an FRT circuit simulating a voltage drop was installed on the grid output side of the : permanent magnet generator FRT: fault ride through (s)Time (s)System active power output (pu)Voltage on grid output side (kV)Instantaneousvoltage 8 6 4 202468 5 Example FRT Function Test example shows that output continued during the interval in which the power voltage dropped to 0 V.
10 Generation output recovered within seconds after the voltage was Review Vol. 65 (2016), No. 4 941 - 51 -effects such as the equivalently applied centrifugal force, and then multiplied by a conversion factor to calculate the bending 7 and Fig. 8 show the flap bend evaluation results while generating power . Fig. 7 shows the average, maximum, minimum, and standard deviation values for 10 minutes of data. Fig. 8 shows the damage equivalent load (DEL). Values labeled measured in the diagrams are actual measurement values, and values labeled design are design values obtained using an aeroelastic analysis software application called Bladed(6). The values are ratios to the DEL design value at 10 was calculated using the following = ( Rim ni/neq)1/m (1)Where Req is the DEL, Ri is the load range of the ith bin in the fatigue load spectrum, ni is the repetition count of the ith bin in the fatigue load spectrum, neq is the equivalent repetition count (600), and m is the slope of the stress-number of cycles to failure (S-N) curve of the measured average values and design average values in Fig.