Transcription of DHL Global Forwarding, Freight OCEAN FREIGHT …
1 1 OCEAN FREIGHT MARKET UPDATE DHL Global Forwarding, FREIGHT August 2017 2 2 Contents TOPIC OF THE MONTH China Cosco Shipping s offer to acquire OOCL HIGH LEVEL DEVELOPMENT MARKET OUTLOOK FREIGHT Rates and Volume Development ECONOMIC OUTLOOK & DEMAND DEVELOPMENT CAPACITY DEVELOPMENT CARRIERS Mergers, Acquisitions and Alliances / Z-Score Update REGULATIONS ? DID YOU KNOW ? Congestion in European ports DHL Global Forwarding | OFR Market Update | Aug 2017 3 3 Topic of the Month China Cosco Shipping s offer to acquire OOCL A P R O M I S I N G O F F E R THE OFFER It values OOIL s1) share at HKD (USD ). It is 31% higher than its closing value on the day the offer was issued. COMPARING THE OFFER The offer values OOCL at USD , OOIL s P/B ratio (=the net worth of all of OOCL s assets minus their debt). In comparison, CMA-CGM acquired NOL for its P/B ratio. Although this final figure may be considered as high, OOIL has historically been more profitable than NOL and FREIGHT earnings are higher today than they were at the time of NOL s acquisition.
2 Investors have had concerns that the deal may not receive regulators approval: shares were last traded at HK$ as at 25 July, for a 7% discount to the COSCO/SIPG offer price. EXPECTED BENEFITS OF THE ACQUISITION China Cosco Shipping is taking over the 3% market share of OOIL on the Global container trade. More specifically, it reinforces the acqueror s position on several trade routes. The acquisition certainly asserts China Cosco s leadership on the North East Asia - Oceania route, taking up to control short of a 1/3 of the trade. FINANCING THE OFFER China Cosco is offering to buy of the shares, while Shanghai International Port Group would own the remaining It is solely financed through external debt. 79 JULY 7TH VALUE OFFER 60 SIPG China Cosco Shipping 96% NOL ACQUISITION PRICE V. P/B OOIL ACQUISITION PRICE V. P/B OOIL P/B RATIO NOL P/B RATIO 140% TRADE COSCO SHARE COSCO +OOCL INCREMENTAL SHARE Asia - Indian subcontinent 6% 11% +6% NE Asia - Oceania 14% 27% +13% North Europe - North America 2% 7% +5% Asia - Europe 11% 15% +4% Transpacific 11% 18% +7% Source: Drewry, Alphaliner.
3 1) OOIL is the mother company of OOCL DHL Global Forwarding | OFR Market Update | Aug 2017 4 4 High Level Market Development Supply and Demand now Balancing 2017F2018F2019F2020F2021 FCAGR(2017-2021) 200 0 600 1 200 1 000 800 Q2 Q1 17 Q4 Q3 Q2 Q1 15 Q3 Q3 Q2 Q1 16 Q4 2 500 2 000 1 500 1 000 500 0 Q4 Q3 Q4 Q3 Q2 Q1 16 Q3 Q2 Q1 17 Q2 Q1 15 800 600 400 200 0 Q3 Q4 Q3 Q2 Q1 17 Q2 Q1 15 Q3 Q2 Q1 16 Q4 BIX MGO BIX 380 SHANGHAI CONTAINERIZED
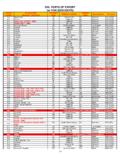
4 FREIGHT INDEX (SCFI)3) WORLD CONTAINER INDEX (WCI)2) BUNKER PRICE INDEX ECONOMIC OUTLOOK GDP GROWTH BY REGION SUPPLY VS DEMAND GROWTH Source: 1)real GDP, Global Insight, Copyright IHS, Q4 2016 . All rights reserved; 2)Drewry, in USD/40ft container, including BAF & THC both ends, 42 individual routes, excluding intra-Asia routes; 3) Shanghai Shipping Exchange, in USD/20ft container and USD/40ft container for US routes, 15 routes from Shanghai, 4) Global Insight, Drewry, 5) Bunker Index, in USD/metric ton, Bunker Index MGO (BIX MGO) is the Average Global Bunker Price for all marine gasoil (MGO) port prices published on the Bunker Index website, Bunker Index 380 CST (BIX 380) is the Average Global Bunker Price for all 380 centistoke (cSt) port prices published on the Bunker Index website -10-50510155,3% 2013 5,5% 5,1% 2012 6,1% 4,9% 13,7% 2009 6,8% -9,2% 3,4% 2015 7,4% 2,2% 2014 6,3% 2016 4,3% 2018E 4,5% 2017E 4,7% 4,2% 3,1% 2011 8,0% 7,8% 2010 9,7% Demand Supply DHL Global Forwarding | OFR Market Update | Aug 2017 5 5 Market Outlook August 2017 Major Trades Strong volume and upcoming peak season in conjunction with capacity control by carriers leads to further increasing rates EXPORT REGION IMPORT REGION CAPACITY RATE EURO AMNO = = AMLA = + ASPA = = MENAT = = SSA = = AMNO AMLA = + ASPA = = EURO = = MENAT = = SSA = = EXPORT REGION IMPORT REGION CAPACITY RATE AMLA AMNO = + ASPA - = EURO = + MENAT = = SSA = + ASPA ASPA = = AMNO = + AMLA = + EURO + + MENAT = = OCEANIA = + KEY Strong Increase ++ Moderate Increase + No Change = Moderate Decline - Strong Decline - - DHL Global Forwarding | OFR Market Update | Aug 2017 6 6 Market Outlook August 2017 OCEAN FREIGHT Rates Major Trades NEW.
5 Market outlook on smaller trades available in the back-up O C E A N F R E I G H T R A T E S O U T L O O K ASPA EURO As we enter the traditional peak season in Q3, uptick in demand is expected and market rates are expected to increase further. General expectation for carriers to implement PSS/GRI EURO ASPA Rates are stabilizing; pick-and-choose of carriers continues ASPA AMLA Space will continue to be tight as we enter into the traditional peak period. There are a few extra loaders to ECSA, but only to evacuate rolling cargoes, not for spot deals and special rates. We also hear of some carriers regrouping to Mexico & WCSA, with small capacity increase, yet to be confirmed. GRIs have been announced for 1st & 15th Aug 17. ASPA AMNO The trade is in the peak and carriers indicating full ship situation. Spot rates expected to increase substantially with two planned increases on Aug 1st GRI & Aug 15th PSS. EURO AMNO Well utilized vessels and lifting still strong in July.
6 Short term rates will remain unchanged the rest of the quarter. ASPA MENAT Still facing high utilization into Middle East and Africa. Carriers have successfully implemented GRI in July, and remain firm on limiting low paying cargo on board. ASPA ASPA Rates into IPBC region have stabilized. Though space continue to be tight, we are not seeing mid month rate increases as opposed to preceding months. Customers should continue to be encouraged to place bookings at least 2-3 weeks in advance to minimize probability of space rejections. Despite period being the traditional slack season for the trade to SPAC, some carriers are already experiencing space issues out of certain ports. Bookings should be made as early as possible to secure space. The peak season is expected to start in August. DHL Global Forwarding | OFR Market Update | Aug 2017 7 7 Market Outlook Volume Outlook in Main Trade Lanes, 2017 Estimate & Growth Forecast 2017/20 in % N O R T H A M E R I C A I n c l.
7 M E X I C O mTEU + mTEU + mTEU + mTEU + N O R T H A M E R I C A I n c l . M E X I C O L A T I N A M E R I C A E U R O P E I n c l . M E D mTEU + mTEU + mTEU + mTEU + mTEU + mTEU + 2017e, in mTEU 2017e-2021e CAGR, in % F A R E A S T I N T R A A S I A excl. Oceania mTEU + mTEU + mTEU + L A T I N A M E R I C A G L O B A L C O N T A I N E R T R A D E 2 0 1 7 e 1 3 8 . 5 m T E U + 2 . 3 % C A G R 2017e-2020e Mid-term growth is mainly driven by Asian tradelanes. Source: Drewry DHL Global Forwarding | OFR Market Update | Aug 2017 8 8 Economic Outlook & Demand Development A S H A R P D E C L I N E I N E C O N O M I C P O L I C Y U N C E R T A I N T Y EURO Latest elections pave the way towards business-friendly policies. Business and consumer confidence are high. Brexit uncertainties makes UK business confidence slide Strong retail sales and foreign trade contribute to growth in the rest of the EU AM Reduced uncertainty boosts consumer and business spendings.
8 More uncertainty regarding 2018 growth, as it partly depends on the rollout of President Trump s fiscal stimulus. US Fed and CA Bank of Canada started gradually raising interest rates. 2017 growth to average , solidly pushed by consumer spendings. Decline in goods prices, whilst services are inflating AP JP: Prime minister Abe s scandals are unlikely to affect the political and economic outlook of the country. CN: Fast industrial sector growth, smaller contribution of consumption to the GDP growht lead to think the old Chinese model is returning EMERGING MARKETS 20 years after the Asian financial crisis, we see elevated debt burden in large emerging markets such as KR, MY, HU and BR, that may undermine growth on the long term. Gains are up in the commodities market BR s PMI is negative, RU s declined. Source: Global Executive Summary, IHS Markit, July 2017 DHL Global Forwarding | OFR Market Update | Aug 2017 9 9 Capacity Development Source: Alphaliner, carriers C A P A C I T Y D E V E L O P M E N T The idle fleet slightly fell, to the favor of an increased demand for smaller 1 000-3 000 TEU ships.
9 As these ships are controled by NOOs, the NOO share of idle fleet dropped from 85 to 79%. Idle fleet in other segments remained flat. By assigning two 13 000+ TEU maxi-neo-panamax scale vessels to the Asia-USEC loop the CMA CGM T. ROOSEVELT and the CMA CGM J. ADAMS will become the largest container ships to transit through the Panama Canal. The G6 Alliance came to an end with the unloading in China of the ship that performed the last G6 sailing from Europe. The ship sailed at the end of March but had yet to complete its round trip Delivery of the first Maersk-H-Type MAERSK HONG KONG (15 282 TEU). The new H-type units have a more compact layout than other ships of comparable TEU capacity. The expanded Panama Canal has been able to recover most of the traffic share between Asia and the East Coast of North America. It had previously lost that share to the Suez Canal route. However, the race for market share seem to continue as the Suez Canal Authority has announced reduced tariffs for neo-panamax container ships from 1 Oct 17 aiming to draw back the Suez Canal services.
10 CMA CGM and Seatrade are to offer a joint weekly service out of their Europe-Pacific USEC offerings as of October 2017. It will be the only direct container reefer service linking the South Pacific and New Zealand to Europe. CMA CGM s joint Europe-Oceania service with Hapag-Lloyd is to shift its call at Port Kelang to Piraeus on the South East Asia Europe leg. Hapag-Lloyd is to upsize its Europe-West Africa service through a vessel sharing agreement with Arkas Line. Arkas will also replace its ZIM-Cosco-Linea Messina West Med-WAF service by another agreement with Hapag-Lloyd. MSC is to grow its presence on the Far East Africa and ISC Far East trades, streamlining its existing Africa Express service. It involves, between other, a faster Far East West Africa southbound connection that will reduce the number of wayport calls, shrinking the transit time by a week. Source: Alphaliner DHL Global Forwarding | OFR Market Update | Aug 2017 10 10 Global Capacity Development all Trades 20 19 23 23 23 24 28 28 27 Highest scrapping level ever Idling remains high [TTEU] 602 (May 2017) 1,324 Q4 2016 Q4 2015 1,359 Q4 2014 228 Q4 2013 779 Q4 2012 809 Q4 2011 595 Q4 2010 356 Q4 2009 1,480 Returning capacity well absorbed by demand [TTEU] 381 2013 444 2012 332 2011 75 2010 131 2009 351 +239% Apr 17 YTD 205 2016 654 2015 193 2014 Average age Net capacity growth remains low Net capacity growth 2017E Scrapping Net capacity growth Scheduled capacity growth Post-ponements Orders placed by year [TEU m] Vessel deliveries by year [TEU m] 2015 2016 2014 2013 2012 2011 2010 2009 2008 2007 Apr17 YTD +33% 2017E 2016 2015 2014 2013 2012 2011 2010 2009 2008 2007 15,300 TEU Very few deliveries expected post 2017 Source.