Transcription of DHL Global Forwarding, Freight OCEAN FREIGHT MARKET …
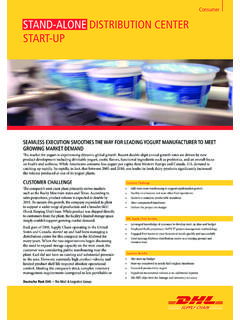
1 1 OCEAN FREIGHT MARKET UPDATE DHL Global forwarding , FREIGHT February 2018 PUBLIC 2 2 Contents DHL Global forwarding | OFR MARKET Update | Feb 2018 TOPIC OF THE MONTH Truck Power Shortages HIGH LEVEL DEVELOPMENT MARKET OUTLOOK FREIGHT Rates and Volume Development ECONOMIC OUTLOOK & DEMAND DEVELOPMENT CAPACITY DEVELOPMENT CARRIERS REGULATIONS ? DID YOU KNOW? Containership Deliveries, Deletions and Orders Top 15 Carriers' Operated Capacity Growth BACK-UP PUBLIC 3 3 Topic of the Month Truck Power Shortages Truck Power Capacity/Shortages (major factors impacting truck capacity) Driver shortage due to the recent ELD mandate. Drivers are no longer able to exceed their hours of operation limit Infrastructure and congestion Increasing cost of operations and labor Inclement weather conditions in the Central and Southeast regions caused terminal and road closures, creating a backlog for the port and rail terminal affected Limited free time at the US inland rail ramps Chassis shortage on a nationwide basis.
2 There are more coming out and less going back in The Electronic Logging Device (ELD) Factor The ELD rule was mandated by congress and is intended to help create a safer work environment for drivers, and the public. It also makes it easier and faster to accurately track, manage, and share records of on-duty status data. An ELD synchronizes with a vehicle engine to automatically record driving time, for easier, more accurate hours of service (HOS) recording. What is the impact? With the current congestion at the terminals, pre-pulls could be required or port detention could be implemented in areas where currently not assessed by the motor carriers. Driver free time could be reduced and the cost-per-hour increased once in detention. Layover charges or tiered rating could be implemented on drayage moves 250 miles or higher. Increased utilization of the inland rail terminals, bringing a heavier volume of local drayage What can be done to reduce impact? Ensure customs clearance is done at the port of discharge vs.
3 Railing in-bond Understand how the drivers hours and the ELD mandate could affect your shipment deliveries Ensure FREIGHT payment and the Original Bill of Lading are submitted as early as possible Divide the volume on multiple sailings and if on same vessel on different Bill Of Ladings Offer flexible loading & unloading timeslots for drivers 24/7 if possible Provide quicker loading & unloading turn around eg by having FREIGHT staged ready for pick up, or labor ready for unloading Working directly with our centrally managed drayage partner network on merchant haulage options for pick-ups and deliveries to gain better control of our inland drayage nationwide DHL Global forwarding | OFR MARKET Update | Feb 2018 Source: DGF PUBLIC 4 4 High Level MARKET Development Supply and Demand 1 000 800 600 400 200 0 Q1 18 Q4 Q3 Q2 Q1 16 Q1 17 Q4 Q3 Q2 2 000 1 500 1 000 500 0 Q2 Q1 16 Q1 18 Q4 Q3 Q2 Q1 17 Q4 Q3 800 600 400 200 0 Q4 Q3 Q2 Q2 Q3 Q1 17 Q1 16 Q4 Q1 18 BIX 380 BIX MGO SHANGHAI CONTAINERIZED FREIGHT INDEX (SCFI)3) WORLD CONTAINER INDEX (WCI)2) BUNKER PRICE INDEX 5) ECONOMIC OUTLOOK 1) GDP GROWTH BY REGION Source: 1)real GDP, Global Insight, Copyright IHS, Q2 2018.
4 All rights reserved; 2) Drewry Container Forecaster Forecast Global supply-demand balance; 3) Shanghai Shipping Exchange, in USD/20ft container and USD/40ft container for US routes, 15 routes from Shanghai, 4) Global Insight, Drewry, 5) Bunker Index, in USD/metric ton, Bunker Index MGO (BIX MGO) is the Average Global Bunker Price for all marine gasoil (MGO) port prices published on the Bunker Index website, Bunker Index 380 CST (BIX 380) is the Average Global Bunker Price for all 380 centistoke (cSt) port prices published on the Bunker Index website DHL Global forwarding | OFR MARKET Update | Feb 2018 2017F 2018F 2019F 2020F 2021F CAGR (2018-2021) EURO MEA AMER ASPA DGF World PUBLIC Supply Growth % Demand Growth % 0%1%2%3%4%5%6%7%8%9%2015201620172018F201 9F2020F2021 FSUPPLY/DEMAND GROWTH RATE (ANNUALIZED), IN %1 5 5 MARKET Outlook February 2018 Major Trades Rates from Asia to North America are raising ahead of contract season.
5 KEY Strong Increase ++ Moderate Increase + No Change = Moderate Janline - Strong Janline - - EXPORT REGION IMPORT REGION CAPACITY RATE EURO AMNO = + AMLA = = ASPA = - MENAT = = SSA = = AMNO AMLA = + ASPA = = EURO - = MENAT = + SSA = = EXPORT REGION IMPORT REGION CAPACITY RATE AMLA AMNO = = ASPA = = EURO = = MENAT = = SSA = = ASPA ASPA - - ++ AMNO = + AMLA + - EURO = + MENAT = + OCEANIA - = DHL Global forwarding | OFR MARKET Update | Feb 2018 Source: DGF PUBLIC 6 6 MARKET Outlook February 2018 OCEAN FREIGHT Rates Major Trades MARKET outlook on smaller trades available in the back-up o c e a n f r e i g h t R A T E S O U T L O O K ASPA EURO The overall space situation is getting tight before the CNY. An extensive blank sailing program is in place by all alliances and will start from wk7 onwards EURO ASPA & MEA Part of the carriers are trying to keep rates stable; even pushing upwards from certain areas. Others are out with reductions. Translated to overall volume, it means ongoing slow decay, though.
6 ASPA AMLA Rates to ECSA came down due to 5 extra loaders in Jan 2018 and also PIL entry into this trade. But rates are expected to increase from Feb 2018, for CNY rush. No blank sailing announcement so far to ECSA. But for WCSA/MX, there are numerous blank sailing for CNY and shared with internal stake holders. ASPA AMNO Full ship situation till CNY. Most carriers are facing stronger rollovers into USEC. All the Alliances have also announced their blank sailings from week 8 to 10. EURO AMNO OCEAN rates are stable but US haulage rates are on the up rise due to ELD and shortage. ASPA MENAT Pre CNY rush is now ongoing. Carriers has successfully pull through some mitigated GRI into MENAT lanes. Expected this to continue, with more upcoming blank sailings in February. ASPA ASPA Space ex China to India and Pakistan is expected to be extremely tight as almost 80% of the services in the MARKET will be blanked from week 7 to week 9 (12 Feb-28 Feb). Various blank sailings have also been planned on the pure IA trade, for those same congestion at Chittagong will continue because of high container yard utilisation.
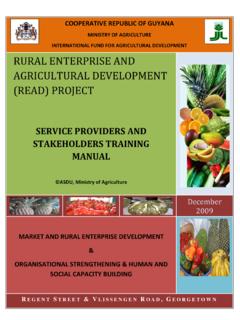
7 Delays are to be expected. AMNO EURO USEC capacity will decrease significantly week 5 & 7 where as USWC capacity will increase drastically week 7 & 9 Rates remain stable DHL Global forwarding | OFR MARKET Update | Feb 2018 Source: DGF PUBLIC 7 7 Economic Outlook & Demand Development Wrapping up 2017 and Looking at 2018 Source: DPDHL Group Macroeconomic Outlook, Global Executive Summary, IHS, Purchasing Manager Index Manufacturing, DHL Global forwarding | OFR MARKET Update | Feb 2018 PUBLIC EURO European growth projection has been raised to in 2017 and in 2018, mainly driven by a stronger Germany. Continuously improving labor markets, decent Global demand, improving financial stability and currently elevated business and consumer confidence support the growth. AMNO US economy has proven resilient despite two devastating hurricanes in the third quarter. Euro has gained 10% against US dollar since January 2017, while Canadian dollar remained at relatively stable level.
8 Therefore, the regional forecast rose to in 2017. ASPA In relative terms, the Asia-Pacific region continues to lead Global growth. The region is projected to expand in 2017 and in 2018, considerably stronger than the world s GDP growth rate average of EMERGING MARKETS AMLA: Regional GDP forecast improved for 2017 to , as Argentina and Brazil came out of recession. Latin America's GDP growth will continue on a soft accele-ration path, reaching in 2018. Brazilian economy is expec-ted to expand modestly in the near term, while Mexican outlook is clouded by tight fiscal and monetary policies and prolonged renegotiation of NAFTA. MEA: Economic outlook slightly brightened for 2017. Growth in 2018 is expected to be above 3%. On the downside, Qatar s political rift with the GC3+1 (Saudi Arabia, the UAE, Bahrain, and Egypt) as well as IS and conflicts in Syria, Yemen, and Libya pose risk to the regional outlook DEMAND DEVELOPMENT European exports forecast for 2017 improved to - Eurozone Manufacturing PMI was above 60 points in November 2017 and at its best reading apart from April 2000 s series-record high.
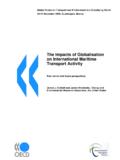
9 USA: On the heels of improved Global demand and the depreciation of the dollar, exports are forecasted to grow in 2017 and in 2018. Manufacturing PMI has leveled out in November 2017, but remains strong heading into the end of the year ASPA: 2017 and 2018 export forecasts for major Asian economies have brightened. Chinese manufacturing PMIs signaled expansion in November. Japanese Manufacturing PMI continued expansion in November 2017, however, continuously strong growth of incoming orders put pressure on supply chains AMLA: Brazil manufacturing PMI signaled a solid improvement in November 2017. Mexican PMI signaled contraction in October 2017 as a result of the earthquakes and volatile exchange rate, but expanded again in November. MEA: Export outlook was revised down for 2017 and 2018 to and respectively. UAE PMI signaled strong expansion in November. 8 8 Capacity Development Source: Alphaliner, carriers C A P A C I T Y D E V E L O P M E N T The Global containership fleet is expected to grow by this year, after taking into account projected vessel deliveries, deferrals and scrapping, to reach Mteu by the end of 2018.
10 The pace of the container fleet growth is accelerating from , recorded in 2016, and in 2017. Total new containership capacity due to be delivered in 2018 is expected to reach Mteu. More than 50% of this is expected to be made up of ULCS from 14,000 teu to 21,000 teu mostly scheduled for delivery in the first half of the year, with over due before the end of June. Several carriers have however taken action by deferring delivers from 2018 to the next year. Megamax Containership deliveries in Jan 2018 : MARSEILLE MAERSK and MANCHESTER MAERSK EEE-Mk II -class ships (20,568 teu) are delivered to Maersk early Jan 18. Both vessels have joined the Maersk-MSC Far East Europe AE-7/Condor loop. OOCL INDONESIA (21,413 teu) is delivered on 18 Jan 18 to OOCL and joins OCEAN Alliance Asia-Europe NEU1 loop COSCO SHIPPING ARIES (19,273 teu) is delivered to Cosco Shipping and joins the OCEAN Alliance Asia-Europe NEU2 loop When the OCEAN Alliance and THE Alliance announced their new 2018 service networks no new Far East Europe or Far East North America loops were announced.