Transcription of DNA Quality Spectrophotometry and Electrophoresis
1 7 DNA Quality : Electrophoresis , Spectrophotometry and fluorometry Ambika B Gaikwad After isolation of DNA, quantification and analysis of Quality are necessary to ascertain the approximate quantity of DNA obtained and the suitability of DNA sample for further analysis. This is important for many applications including digestion of DNA by restriction enzymes or PCR amplification of target DNA. The most commonly used methodologies for quantifying the amount of nucleic acid in a preparation are (A) electrophoretic run along with standard DNA (B) spectrophotometric estimation and (C) flourometric determination (D) DNA quantification using NanoDrop A. Agarose Gel Electrophoresis for DNA Quantification and Quality Analysis This method of quantification is based on the ethidium bromide fluorescent staining of DNA. Ethidium bromide is a fluorescent dye, which intercalates between the stacked bases.
2 The fluorescent yield of the dye:DNA complex is much greater than the unbound dye. UV irradiation at 254nm is absorbed by the DNA and transmitted to the dye and the bound dye itself absorbs radiation at 302nm and 366nm. This energy is retransmitted at 590nm, the reddish-orange region of the visible spectrum. In case of plant genomic DNA, the nucleic acids are electrophoretically separated on a agarose gel containing ethidium bromide at a final concentration of g/ml. The quantity of DNA can be estimated by comparing the fluorescent yield of the samples with a series of standards, for instance, lambda ( ) DNA at varying known concentrations. This provides a very rapid and sensitive means of estimating the nucleic acid concentration. A large number of samples with as little as 5ng of DNA can be quantified. Besides quantification, it also allows provides the advantage of analyzing the Quality of the DNA preparation.
3 Native DNA, which migrates as a tight band of high molecular weight ( 40 kb), presence of RNA, and degraded/sheared DNA, if any, can be visually identified on the gel. Procedure 1. Prepare a agarose gel. 2. Add 1 l of 6X gel loading dye to 2-3 l of each DNA sample before loading the wells of the gel. Addition of dye allows us to note the extent to which the samples might have migrated during Electrophoresis , so that it can be halted at an appropriate stage 8 3. Load at least 1 or 2 wells with uncut, good Quality DNA or any previously quantified DNA samples (50ng and 100ng) as molecular weight standards. 4. Run the submarine electrophoretic gel at 70V till the dye has migrated one-third of the distance in the gel. 5. DNA can be visualized using a UV transilluminator and quantified in comparison with the fluorescent yield of the standards. B. DNA quantification by UV spectroscopy Analysis of UV absorption by the nucleotides provides a simple and accurate estimation of the concentration of nucleic acids in a sample.
4 Purines and pyrmidines in nucleic acid show absorption maxima around 260nm (eg., dATP: 259nm; dCTP: 272nm; dTTP: 247nm) if the DNA sample is pure without significant contamination from proteins or organic solvents. The ratio of OD260/OD280 should be determined to assess the purity of the sample. This method is however limited by the quantity of DNA and the purity of the preparation. Accurate analysis of the DNA preparation may be impeded by the presence of impurities in the sample or if the amount of DNA is too little. In the estimation of total genomic DNA, for example, the presence of RNA, sheared DNA etc. could interfere with the accurate estimation of total high molecular weight genomic DNA. Procedure 1. Take 1 ml TE buffer in a cuvette and calibrate the spectrophotometer at 260nm as well as 280nm. 2. Add 10 l of each DNA sample to 900 l TE (Tris-EDTA buffer) and mix well.
5 3. Use TE buffer as a blank in the other cuvette of the spectrophotometer. 4. Note the OD260 and OD280 values on spectrophotometer. 5. Calculate the OD260/OD280 ratio. 6. The amount of DNA can be quantified using the formula: DNA concentration ( g/ml) = OD260 x 100 (dilution factor) x 50 g/ml 1000 Inferences: A ratio between denotes that the absorption in the UV range is due to nucleic acids. A ratio lower than indicates the presence of proteins and/or other UV absorbers. A ratio higher than indicates that the samples may be contaminated with chloroform or phenol. In either case (< or > ) it is advisable to re-precipitate the DNA. Spectrophotomteric Conversions for Nucleic Acids: 1 A 260 of ds DNA = 50 g/ml 1 A 260 of ss oligonucleotides = 33 g/ml 1 A 260 of ss RNA = 40 g/ml 9 C. DNA quantification using flourimeter Fluorometric procedures are popular since it is simple and much more sensitive than the previous two methods.
6 Bisbenzmide (Hoechst Dye-H33258) exhibits changes in fluorescence characteristics in the presence of DNA that allow accurate DNA estimation. The dye is non-intercalating, binds to the minor groove of DNA (with marked preference to AT rich regions and gives 458 nm. Since RNA does not generally bind to H33258, the measured fluorescence is a direct indicator of DNA concentration, provided a clean DNA standard of known concentration is used. Sensitivity of H33258 decreases with nuclease degradation, increasing GC content or denaturation of DNA. In preparations with minimal RNA contamination or in samples with unusually high GC content, EtBr fluorescence is the choice. Here, sensitivity is ~20 times less compared to Hoescht dye. EtBr have 302 or 546 excitation and 590 emission and fluorimeter capable of detecting the same can be used for quantification. Materials required 10x TNE ( 1000 ml, buffer stock solution): 100 mM Tris 1M Na Cl 10 mM EDTA (Dissolve in 800 ml distilled water.))
7 Adjust pH to with HCL. Add distilled water to make the volume 1000 ml. Filter and autoclave before use. Store at 4 C for up to 3 months.) Hoechst 33258 dye stock: Hoechst 33258 : I mg /ml in distilled water. (Add 10 ml distilled water to 10 mg H33258. Do not filter. Store at 4 C for up to 6 months in an amber bottle.) Procedure 1. Prepare the assay and DNA standard solutions as described below: DNA assay solution Low range (A): (10-500 ng/ml final DNA concentration) H33258 stock solution : l 10x TNE buffer : ml Distilled filtered water : ml High range (B): (100-5000 ng/ml final DNA concentration) H33258 stock solution : l 10x TNE buffer : ml Distilled filtered water : ml 2. Turn on the fluorimeter ( Hoefer) at least 15 min before using. 10 3. Zero the instrument : Prepare an assay blank using 2 ml of appropriate Assay solution (A or B for high DNA concentration).
8 Dry the sides of a cuvette. Insert the cuvette into the well, close the lid, and press ZERO . After 0 displays, remove the cuvette. 4. Calibrate the instrument : Deliver 2 l of the appropriate DNA standard solution ( low or high range) to 2 ml of Assay solution in the cuvette. Mix by pipetting several times into a disposable transfer pipette. Place cuvette in well, close the lid and press CALIB . Enter 100 for the low range assay, 1000 for the high range assay and press ENTER . After the entered value displays, remove the cuvette. 5. Zero the instrument: Empty and rinse the cuvette. Dry by draining cuvette and blotting upside down on a paper towel. Add 2 ml of the same Assay Solution used in step 2, insert the cuvette into the well, close the lid, and press ZERO . After 0 displays remove the cuvette. 6. Measure the sample and mix well. Place the cuvette in the well, close the lid, and record the measurement.
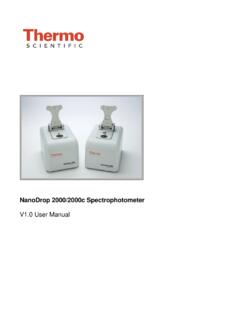
9 D. DNA quantification using NanoDrop The Thermo Scientific NanoDrop 1000 Spectrophotometer measures 1 ul samples with high accuracy and reproducibility. The full spectrum (220 nm-750 nm) spectrophotometer utilizes a patented sample retention technology that employs surface tension alone to hold the sample in place. This eliminates the need for cumbersome cuvettes and other sample containment devices and allows for clean up in seconds. In addition, the NanoDrop 1000 Spectrophotometer has the capability to measure highly concentrated samples without dilution (50X higher concentration than the samples measured by a standard cuvette spectrophotometer). Operation A 1 ul sample is pipetted onto the end of a fiber optic cable (the receiving fiber). A second fiber optic cable (the source fiber) is then brought into contact with the liquid sample causing the liquid to bridge the gap between the fiber optic ends.
10 The gap is controlled to both 1 mm and mm paths. A pulsed xenon flash lamp provides the light source and a spectrometer utilizing a linear CCD array is used to analyze the light after passing through the sample. The instrument is controlled by PC based software, and the data is logged in an archive file on the PC. Procedure 1. Switch on the instrument including desktop 2. Click on the ND 1000 icon which is present on the desktop 3. After getting home page of programmes set default user and click on nucleic acid 4. Module Startup: When the software starts, you should see a message on screen having two boxes Ok And Cancel : For best results, ensure measurement pedestal surfaces are clean, load a water (1ul) sample onto the lower measurement pedestal and then click OK . The message Initializing Spectrometer- please wait will appear. When this message disappears, the instrument will be ready for use.


