Transcription of Doppler Color Flow Imaging #4 - Cardioland
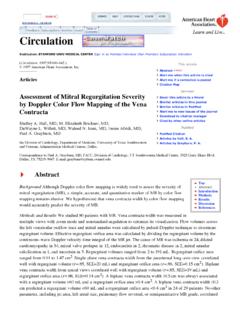
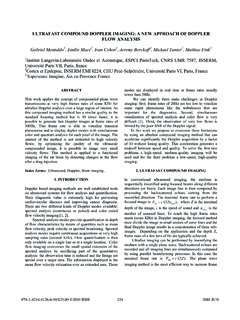
1 Doppler Color Flow Imaging #4 Joseph A. Kisslo, MD David B. Adams, RDCS INTRODUCTION Doppler Color flow Imaging is a method for noninvasively Imaging blood flow through the heart by displaying flow data on the two-dimensional echocardiographic image. This capability has generated great excitement about the use of the technique for identifying valvular, congenital, and other forms of heart disease, as the Color flow image imparts spatial information to the Doppler data. To inexperienced Doppler users, the Color flow display makes the Doppler data more readily understandable because of the avoidance of complex spectral velocity displays. Color FLOW Imaging IN CLINICAL PRACTICE Doppler Color Flow Imaging In Figure there is a mitral regurgitant jet into the left atrium in systole and the regurgitant blood flow is displayed on the two-dimensional echocardiographic image.
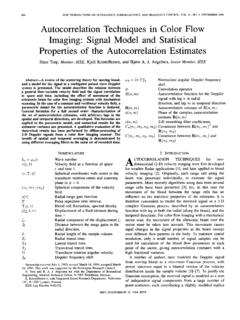
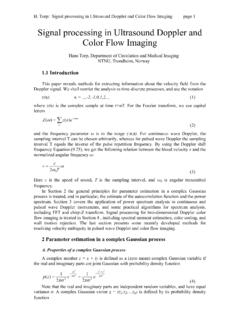
2 In Color flow Imaging , the colors red and blue represent direction of a given jet; the various hues from dull to bright represent the differing velocities. When turbulence is present, a mosaic of many colors results. A two-dimensional display of flow is, therefore, produced with ready identification of size, direction, and velocity. The Meaning of Color The colors displayed on the flow map image contain useful information. By convention, Doppler Color flow systems assign a given Color to the direction of flow; red is flow toward, and blue is flow away from the transducer. Three typical Color bars from a Color flow Imaging device are shown in Figure and give an initial frame of Figure 4. 1 Systolic parasternal long-axis Color flow image of mitral regurgitation. The mitral regurgitation jet comprises a mosaic of varying colors. A variance map is used.
3 Note the direction of flow indicated by the Color bar on the right (Abbreviations, page 39). Figure 4. 2 Three Color bars from a Color flow system. When there is no flow, black is displayed (center) in the standard bar (left), flow toward the transducer at the top is in red, flow away in blue. Progressively faster velocities are displayed in brighter shades of red or blue. The center bar is in an enhanced map, and the right bar in a variance map (explained later in the text). reference to the meaning of colors. Such Color reference bars always appear on the screen of Doppler flow Imaging devices. The center of the standard Color bar on the left is black (white center reference mark) and represents zero flow. In addition to simple direction, velocity information is also displayed. Progressively increasing velocities are encoded in varying hues of either red or blue.
4 The more dull the hue, the slower the velocity. The brighter the hue, the faster the relative velocity. In the Color bar shown in the center of Figure , the colors have been enhanced so that the hues of red are increased from very dull red to bright yellow and the hues of blue are increased from very dull blue to a bright pale blue. The enhanced map helps a beginner to understand the relationship between velocity and Color . The bar at the right demonstrates variance. As will be seen later, Color is also used to display turbulent flow and allows an operator to discriminate between normal and abnormal flow states. The Angiographic Concept One way of conceptualizing Doppler Color flow methods is to recognize its similarity to angiography. It provides a noninvasive angiogram of blood flow, where the contrast medium is the moving red blood cells and the detector of this contrast is ultrasound.
5 The complex Doppler ultrasound processing circuitry allows for the detection of movement of these red cells in various directions forward and backward through the heart. Doppler Color flow information, however, is obtained and displayed in a cross-sectional image, making the spatial details of flow and anatomy readily recognizable. In effect, Doppler Color flow looks inside the cineangiographic silhouette. Unlike angiography, Doppler Color flow does not depend on dye dilution accumulated over several heartbeats. Rather it displays an abnormal flow jet for each cardiac cycle. This results in the ability to display the differing sizes of regurgitant jets depending on severity. The larger the volume of the regurgitant jet, the larger the size represented on the display. CREATION OF THE Color IMAGE The Importance of Time Time is the key factor to keep in mind.
6 A conventional two-dimensional ultrasound Imaging system is already working as hard as it can. Pulses must be transmitted along a given line, reflected from the heart valves and walls, then received. The process is repeated, line by line, through the entire sector arc that comprises several hundred lines. This completes one frame of information, usually in one-thirtieth of a second. In order to have the image appear as though it is continuously moving, the entire image must be updated 30 times in a second (30 frames/second). This results in relatively long waiting periods for the transmit-receive sequence to be completed. It also means that considerable amounts of information need to be quickly processed and presented in the image. A problem, therefore, results. If all this time is taken to simply create the image, where is there time to sample rapidly with the Doppler , left and right, in all portions of the image field?
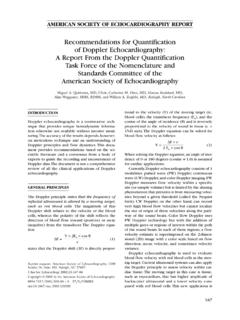
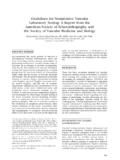
7 From earlier units in this series, we have already learned that high quality Imaging and high quality pulsed Doppler cannot really be conducted simultaneously. Anatomic and Flow Information Together Expressed in its most simplistic terms, Color flow systems add a separate processor that creates the Color flow image based on the returning data and then integrates it with the two-dimensional anatomic image (Fig. ). Both the anatomic and the Color flow data are then displayed in the final image. The returning ultrasound data from any conventional scanner also contains frequency shift information that results from the encounter of the transmitted pulse with moving structures and blood. Until the advent of Color flow Imaging , this frequency shift data was simply ignored. The key to Color flow mapping is that the returning data may also be processed for the frequency shifts (or red blood cell velocities).
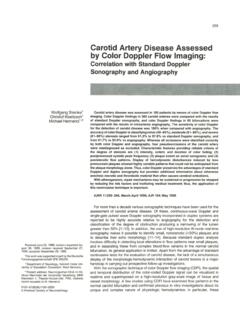
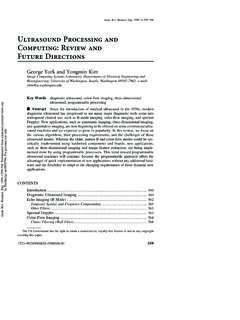
8 Thus, Color flow Imaging systems take advantage of data that are available in every ultrasound image of the heart. While this is a simplistic explanation, it is not true in most Color flow systems. In reality, the lines of Color flow data are alternated with lines of anatomic scan data. The anatomic data are acquired and received by conventional means and the Color flow data are acquired, received, and processed separately. Multigate Doppler Doppler Color flow instruments are all currently based upon pulsed wave (PW) Doppler methods. Conventional PW techniques are range gated (Fig. , left). The Doppler sample volume is determined in range by the time it takes for the ultrasound pulse to travel to the area of interest and then back. If the same method was employed in Color flow, it would simply take too long to sample over the entire image and there would be serious compromises made in frame rate.
9 Instead, all Color flow systems are multigated . In the illustration in Figure (right) a simple ten-gate system is illustrated and compared with the conventional PW approach. Here, a burst of ultrasound is sent into the tissue along a given line and then the system rapidly receives at ten incremental times. This results in the reception of Figure 4. 4 Color flow Doppler systems use PW Doppler principles in a multigate, rather than range-gate format. For details, see text. Figure 4. 3 In a Color flow- Imaging device, the returning echo data are processed through two channels that ultimately combine the image with the Color flow data in the final display. Doppler data from the near flow areas first, while the pulse is still continuing into the tissue. Obviously, reception of the flow data in the far field occurs later. This multigating takes advantage of Doppler information all along the line that is ignored in the conventional range-gated approach.
10 In reality, each line has many gates that number in the hundreds. Figure demonstrates a simple ten-gate system where the amplitude and phase shifts are detected for each gate and presented to the Color flow processor for final display of the Color in each gate. It is best to think of the Color flow map image as comprising little gates throughout the field of view, each gate containing some composite of the Doppler information. A typical image can consist of as many as 256 lines depending upon sector size and depth of range. Figure demonstrates that multiple gates of Color flow information are displayed throughout the entire image along each ultrasound line. More About Color All Doppler flow Imaging systems encode the directions of flow into two primary colors: red and blue. Any number of Color assignments could be made, but red and blue are chosen because they are primary colors of light (together with green).