Transcription of DRIVEN PILE CAPACITY IN CLAY AND DRILLED SHAFT …
1 DRIVEN pile CAPACITY IN clay AND DRILLED SHAFT CAPACITY IN ROCK. FROM FIELD LOAD TESTS. Yasser A. Hegazy, , Andrew G. Cushing, Christopher J. Lewis, D'Appolonia Engineering D'Appolonia Engineering D'Appolonia Engineering Monroeville, PA-USA-15146 Monroeville, PA-USA-15146 Monroeville, PA-USA -15146. ABSTRACT. In this study, two case histories of deep foundations are discussed, including DRIVEN piles and DRILLED shafts. The first case history is an assessment of DRIVEN pile CAPACITY in clay . As part of selecting the deep foundation system, steel pipe, concrete, and timber piles were DRIVEN at the site. Static compression and uplift load tests were performed on the concrete and timber piles, while only static comp ression tests were performed on the steel pipe piles. Measured pile capacities from the static load tests were compared to predicted pile capacities, which were obtained from empirical design methods employing laboratory and in-situ test results.
2 The data demonstrate that the traditional alpha method results in somewhat conservative predictions for the test piles, regardless of whether the values of undrained shear strength (su ) are obtained directly from the unconfined compression (UC) test or are inferred from a correlation with the CPTU as equivalent direct simple shear (DSS) values of s u . The second case study involves an evaluation of the axial and lateral capacities of DRILLED shafts in rock to support a concrete gated dam. The test DRILLED shafts were step-tapered from diameter through the soil zone to 5-ft diameter in the rock socket. Axial and lateral load tests were performed on DRILLED shafts embedded in soft to medium hard clayey shale and claystone overlain by granular alluvium. The data demonstrate that longstanding methods of determining ultimate side resistance are conservative relative to the measured values, as are customary presumptive values, but that predictions using one evolving method can be unconservative in the absence of field verification.
3 In addition, the shafts performed satisfactorily under the applied design load, exhibiting minimal lateral deflection within the rock socket. INTRODUCTION. This paper presents two case histories of deep foundation Geotechnical Conditions installation and load testing. The first involves pipe, timber, and concrete piles DRIVEN into clay , and tested in axial uplift The subsurface stratigraphy consists of deltaic clays and silts, and compression, in association with the expansion of an to a depth of about 140 ft, which overlie the regional fresh industrial facility located near the Mississippi River in water Gonzalez Aquifer. The upper 10 to 12 ft of soil consists Louisiana. The second involves axial and lateral load testing of a stiff to very stiff low plasticity clay and silty clay , which of rock-socketed DRILLED shafts for the new Braddock Gated is heavily overconsolidated due to desiccation.
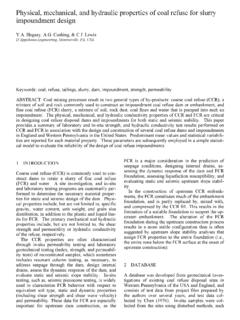
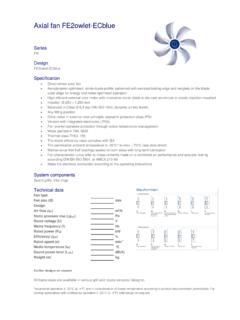
4 This soil is Dam on the Monongahela River near Pittsburgh, underlain by a stiff to very stiff, moderately overconsolidated, Pennsylvania. The details of pile and SHAFT geometry, soil and highly plastic clay to silty clay layer to a depth of about 50 to rock stratigraphy, and load-displacement are provided. In 70 ft. addition, the measured results are discussed in the context of existing predictive methodologies. Undrained shear strength measurements were obtained using the laboratory unconfined compression (UC) test and field vane shear test (VST), as depicted in Figs. 1 and 2, DRIVEN pile FOUNDATIONS FOR respectively. Mean values of laboratory su (UC) and peak field INDUSTRIAL PLANT, LOUISIANA s u (VST), corrected for plasticity index (Bjerrum, 1972), equal 1375 psf and 3300 psf, respectively. The first case history documents the subsurface exploration and pile load test program associated with a proposed Cone penetration tests with porewater measurements (CPTU).
5 Industrial facility in Louisiana. The 33-acre parcel is bounded were also performed at the site. The soil undrained shear by the Mississippi River approximately two miles to the west, and is 19 ft above mean sea level, on average. Paper 1. lengths at the site yield soil strength values which are on the Undrained Shear Strength, s u (psf). order of 60% to 65% of the average s u (UC) profile values 0 2000 4000 6000 8000 10000 inferred from the correlation with CPTU q T. This discrepancy 0 can partly be attributed to the influences of soil anisotropy, in su(UC) - Lab su(UC) - CPTU qT. addition to the stress relief and sample disturbance that soil 20 Correlation specimens experience before being tested in unconfined compression (Ladd and Foott, 1974). Depth (feet). 40. 60 Steel Pipe Piles Static Compression 80 Four steel pipe piles were initially DRIVEN at the site to a depth of , with an additional 1-ft restrike four days later.
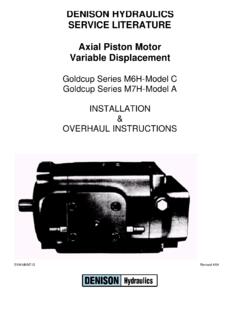
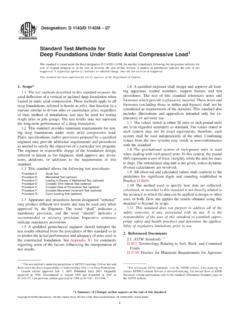
6 Each test pile consisted of a 14-inch outside diameter steel 100. pipe (fy = 45 ksi) with wall thickness, with closed Fig. 1. Variation in laboratory values of su (UC) with depth, ends consisting of -inch thick steel plates welded flush with compared to inferred su (UC) profile from CPTU q T the outside diameter. A Vulcan 06 air hammer was used, and the driving record for each pile is provided in Fig. 3. pile Undrained Shear Strength, s u (psf). penetration rates at the end of initial installation ranged from approximately 20 to 30 blows/ft, and increased to 40 to 83. 0 2000 4000 6000 8000 10000 blows/ft for the 1-ft restrike. Each pile was subsequently load 0 tested in accordance with ASTM D 1143 ( Standard Test Method for Piles Under Static Axial Compressive Load ). 20 Load-displacement curves for the static compression load tests su(VST) - Field on the steel pipe piles are provided in Fig.
7 4. Depth (feet). 40 su(VST) - CPTU qT Blows / ft Correlation 0 5 10 15 20 25 30. 60. 0. Initial Driving Record for 80 14-inch , Closed End, 10. Pipe Piles (12 JUN 1997). 100 20. Depth (feet). Fig. 2. Variation in peak field values of su (VST) with depth, 30. compared to inferred su (VST) profile from CPTU q T. 40 pile 1. strength was also estimated as a function of corrected cone pile 2. 50 pile 3. tip resistance (q T) and total overburden stress ( vo ), as follows (Kulhawy, et al., 1992): pile 4. 60. s u ( UC ) = 0. 0512 [ q T vo ] (1) Fig. 3. Initial driving records for14-inch pipe piles s u ( VST ) = 0. 0906 [ q T vo ] (2). 250. Compression Load Tests on 14-inch , Equations 1 and 2 were employed using mean values of qT Closed End, DRIVEN Pipe Piles from 16 CPTU tests conducted at the site to develop inferred 200 (Length = ft.)
8 Vertical Load (kips). s u (UC) and su (VST) profiles, which are shown on Figs. 1 and 2, respectively. 150. An evaluation of the data in Fig. 2 demonstrates that Eqn. 2 100. provides reasonable estimates of peak field s u (VST). This pile 1. observation can be explained by the fact that both the VST and pile 2. 50. CPTU tests maintain, to a reasonable degree, the in-situ soil pile 3. stress state, which directly influences soil strength. pile 4. 0. Consideration of the data in Fig. 1, however, demonstrates that nearly all of the laboratory-measured values of su (UC) are less Vertical Displacement (inches). than the su (UC) profile inferred from CPTU qT data. In fact, Fig. 4. Load- displacement curves for axial compression load averaging the laboratory su (UC) data over the DRIVEN pile tests on 14-inch , closed end, DRIVEN pipe piles Paper No.
9 2. Blows / ft Concrete and Timber Piles Static Compression and Uplift 0 20 40 60 80 100. Concrete and timber piles were also DRIVEN at the site and 0. Concrete - Compression statically load tested in both compression and uplift. The 10. Concrete - Uplift concrete piles were 14-in. x 14-in. square and DRIVEN to depths 20 Timber - Compression on the order of 82-ft. The timber piles were tapered, with a 30 Timber -- Uplift Depth (feet). tip diameter and 14-in butt diameter, and DRIVEN to 40. depths on the order of 63-ft. (Note: An average diameter of was used in the back-calculation of measured unit 50. side resistance for these tapered timber piles, which is 60. described later in the paper.) 70. 80. Each concrete and timber test pile was DRIVEN using a Vulcan 90. 06 air hammer, and the associated driving records are provided in Fig.
10 5. Load-displacement curves for the static Fig. 5. Driving records for concrete and timber piles compression load tests on the DRIVEN concrete and timber piles are provided in Fig. 6. Load-displacement data for the static uplift tests are provided in Fig. 7. The maximum test loads for 500. these piles are summarized in Table 2. 450. 400. Vertical Load (kips). Measured Versus Predicted DRIVEN pile CAPACITY 350. 300. The first methodology to predict the unit side res istance (fp ) of 250. piles DRIVEN in clay soil, known as the alpha method, was 200 Axial Compression Tests: proposed by Tomlinson (1957) and can be expressed as 150 14 in. x 14 in. Square Concrete follows: 100 pile (L = 82 ft.). Tapered Timber pile (L = 63 ft.). 50. fp = s u (3) 0. where su = mean undrained shear strength along the length of Vertical Displacement (inches).