Transcription of Dynamic Line Rating Overview - Idaho National Laboratory
1 Dynamic line Rating Overview Increasing the capacity of existing power lines T. he electrical grid cooling on transmission and CONCURRENT COOLING. includes about 7,000 distribution lines concurrent PROJECT AREA. operational power with wind power generation, Power utilities operate plants that send electricity while identifying additional transmission lines based over 642,000 miles of capacity, line sag and clearance on static ratings , which set high-voltage transmission concerns. The key is to pay a conservative limit on the Concurrent cooling lines and million miles close attention to the weather.
2 Amount of electric current the enables increased of distribution lines. lines can safely carry without transmission The more electric current a line overheating. Static ratings line capacity and The grid's available capacity carries, the hotter it gets. After renewable energy assume there's little or no wind has been largely unchanged a certain point, a line operator integration. blowing, so in moderately for decades and needs to cannot add additional current windy places, a line 's static increase to accommodate new without overheating and Rating is often much lower than power plants and renewable damaging the line .
3 However, its real transmission capacity. energy projects. The difference an increase in wind speed Those windy places are shared in time and cost between blowing at a right angle to a with wind power plants and using existing lines or the high-voltage line can cool the are called concurrent cooling construction of new ones line enough to safely increase areas because the wind that can make or break plans for the amount of current it can generates power also cools new wind or solar plants. carry by 10 to 40 percent. transmission lines. Using Wind energy researchers at To research these efficiency Dynamic line ratings to manage Idaho National Laboratory gains, INL researchers are capacity on high-voltage believe moving more electricity funded by the Department lines in such places helps through existing transmission of Energy's Office of Energy increase the overall efficiency and distribution lines is both Efficiency and Renewable of power transmission.
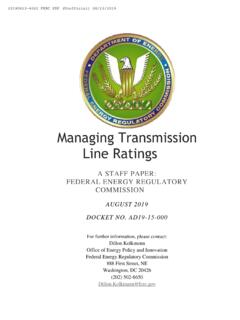
4 Possible and practical. In areas Energy Wind Energy The amount of wind cooling where wind plants are being Technologies Office and a line receives varies with the developed, there is potential collaborate with regional wind's speed, its direction to take advantage of wind power companies. INL researchers use data from weather stations to create a 3D mean wind speed map. The scale shows wind speeds in meters per second. relative to the line , local ambient air temperature and INL researchers and Idaho Power installed more than 40 weather how much sun it gets. To better stations along transmission lines in a windy part of southern Idaho 's understand this concept, interstate utility corridor.
5 Researchers collaborate with researchers use computational IMPROVED line . several regional and National fluid dynamics (CFD) to CAPACITY FORECASTING. entities to study various generate wind resource maps The research team continues complex terrain areas. One of smaller areas, then combine to validate and refine its CFD- such area is a windy part of the different simulation areas in based weather simulation southern Idaho that is an the end to see the big picture. models to run faster and interstate utility transmission generate increasingly more corridor. The research teams The research team started accurate results for complex translate detailed weather, with a weather simulation terrain.
6 The team also works line loading and conductor program that meteorologists, with multiple utility partners temperature information into wind power developers to train system operators in Dynamic line ratings real-time and researchers typically the use of weather station estimates of how much current use to model climate over data and software tools each segment of high-voltage uneven terrain, then they to generate transmission line can safely carry while modified the software to capacity operating limits. The FOR MORE INFORMATION wind power is generated. boost the simulation speed ability to reliably make such with improved resolution CONCURRENT estimates on a large scale and accuracy.
7 Researchers Technical contact COOLING MODEL with high spatial resolution also developed a Java-based Jake P. Gentle INL researchers and Idaho brings power utilities one step software package called 208-526-1753 Power have installed more closer to using a transmission General line Ampacity State than 40 weather stations system dynamically coupled Solver (GLASS), which uses along transmission lines with concurrent cooling weather model results to General contact in windy southern Idaho 's processes to yield greater estimate how much the Abby Todd interstate utility corridor. all-around benefits. weather affects a power line 's Communications Liaison Researchers installed the real transmission capacity.
8 208-526-6166. stations to measure weather This helps determine the conditions along more than relationship between wind 450 line -miles of high-voltage energy generation and transmission lines. Due to the resulting concurrent cooling number of weather stations, of the transmission lines carrying that wind power to homes and businesses. A Department of Energy National Laboratory 20-50443-038-R2 (Updated: 2021).