Transcription of E ONOMI PERFORMAN E OF THE AIRLINE INDUSTRY
1 2017 End-year report 1 ECONOMIC PERFORMANCE OF THE AIRLINE INDUSTRY KEY POINTS Consumers benefit from lower real travel costs, more routes, and will spend 1% of world GDP on air transport in 2018. Economic development is a big winner from the doubling of city pairs and halving of air transport costs over the past 20 years. Governments gain substantially from $136bn of tax in 2018 and from over 70 million supply chain jobs. Stronger economic growth is pushing traffic ahead of capacity growth, but breakeven loads rising as unit costs grow significantly.
2 Equity owners see further gains in 2018; INDUSTRY ROIC falls from record 2016 levels, but remains above the cost of capital. Credit metrics in 2018 not quite as good as 2016, but free cash flow yield is positive and balance sheet metrics are improving. Jobs in the INDUSTRY should exceed million, and GVA/employee is over $109,000, but unit labour costs are rising. Infrastructure use costs are high, plus inefficiencies in Europe alone add 3bn to AIRLINE costs next year. N American airlines perform best with a forecast net post-tax profit margin in 2018. Africa is the weakest with a loss. CONSUMERS Consumers will see a substantial increase in the value they derive from air transport in 2018, including stability in what they pay airlines , after allowing for inflation.
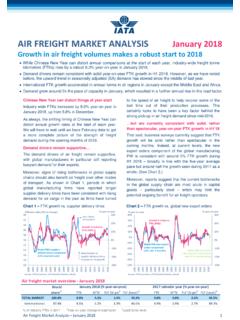
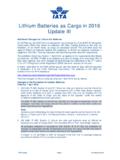
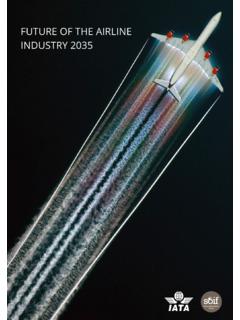
3 New destinations are forecast to rise next year, with frequencies up too; both boosting consumer benefits. We expect 1% of world GDP to be spent on air transport in 2018, totaling $861 billion. RPKs, which have been growing well above trend helped by the economic upturn, are forecast to remain strong in 2018 as stronger economic growth offsets the drag from the rise in oil prices. Falling travel costs have been adding several % points to RPK growth over the past several years. The average return fare (before surcharges and tax) of $355 in 2018 is forecast to be 64% lower than in 1996, after adjusting for inflation. AIRLINE CFOs and heads of cargo reported in October that they were positive about future growth in air travel, and were also positive about cargo.
4 This reflects a more general optimism amongst business worldwide about economic prospects. Consumer confidence has risen too. Despite the uncertainties about US economic policy and wider protectionist rhetoric, the easing in fiscal policy as well as continued loose monetary policy is producing stronger economic growth and some revival in world trade. Note: RPK = Revenue Passenger Km, FTK = Freight Tonne Km, y-o-y = year on year change. GVA = Gross Valued Added (firm-level GDP). * AIRLINE revenue + indirect taxes. Sources: iata , ICAO, OE, Neth CPB, PaxIS, CargoIS. This semi-annual report takes a broad look at how the AIRLINE INDUSTRY is adding value for its consumers, the wider economy and governments, as well as for its investors. Worldwide AIRLINE INDUSTRY 2016 2017 2018 Spend on air transport*, $billion 741 787 861 % change over year % global GDP Return fare, $/pax.
5 (2016$) 371 355 355 Compared to 1996 -63% -64% -64% Freight rate, $/kg (2016$) Compared to 1996 -68% -68% -67% Passenger departures, million 3,810 4,081 4,311 % change over year RPKs, billion 7164 7702 8167 % change over year Freight tonnes, million % change over year World GDP growth, % World trade growth, % 0204060801001202006200820102012201420165 0 = no changeIATA survey of AIRLINE CFOs and heads of cargoPassenger services growth expected in the next 12 monthsCargo services growth expected in the next 12 months 2017 End-year report 2 WIDER ECONOMY Note: RTK = Revenue Tonne Kilometers, GVA = Gross Value Added.
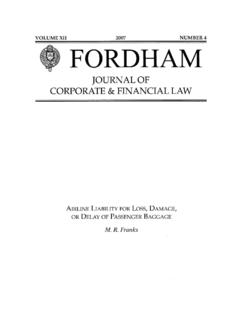
6 The total number of routes or airport pairs is much higher because of multiple airports in some cities and connections are counted both ways. City-pairs: jets + turbo-props larger than 20 seats, at least 1 flight a week; from SRS Analyzer database. Lower transport costs and improving connectivity have boosted trade flows; trade itself has resulted from globalizing supply chains and associated investment. GOVERNMENT Governments have also gained substantially from the good performance of the AIRLINE INDUSTRY . airlines and their customers are forecast to generate $136 billion in tax revenues next year. That s the equivalent of 45% of the INDUSTRY s GVA (Gross Value Added, which is the firm-level equivalent to GDP), paid to governments in payroll, social security, corporate and product taxes (Note that charges for services are excluded).
7 In addition the INDUSTRY continues to create high value added jobs. But in many countries the value that aviation generates is not well understood. The commercial activities of the INDUSTRY remain highly constrained by bilateral and other regulations. Moreover, regulation is far from smart , leading to unnecessarily high costs. Visa requirements discourage inbound tourism and business travel. Encouragingly visa openness levels are improving. Unfortunately, the number of individual ticket taxes is expected to rise to 239 next year, while the level of many existing taxes continues to ratchet upwards. Note: GVA = Gross Value Added (firm-level GDP). Source: iata , Oxford Economics. Sources: iata , ATAG, Oxford Economics, ICAO, SRS Analyser, UNWTO, WTO. Economic development worldwide is getting a significant boost from air transport.
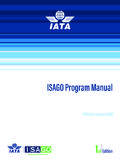
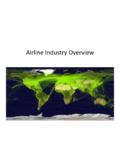
8 This wider economic benefit is being generated by increasing connections between cities - enabling the flow of goods, people, capital, technology and ideas - and falling air transport costs. The number of unique city-pair connections is estimated to have exceeded 20,000 this year, more than double the connectivity by air twenty years ago. The price of air transport for users continues to fall, after adjusting for inflation. Compared to twenty years ago real transport costs have more than halved. Air transport is vital for manufactures trade, particularly trade in components which is a major part of cross border trade today. We forecast that the value of international trade shipped by air next year will be $ trillion. Tourists travelling by air in 2018 are forecast to spend $776 billion.
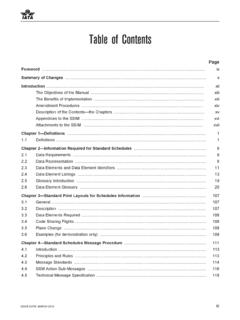
9 Another impact on the wider economy comes through the influence increased AIRLINE activity has on jobs in the sector, in its supply chain, and the jobs generated as spending ripples through the economy. These supply chain jobs around the world are estimated to rise to over 70 million in 2018. Worldwide AIRLINE INDUSTRY 2016 2017 2018 Unique city pairs 18691 20041 Compared to 1996 89% 103% Transport cost, US$/RTK (2016$) Compared to 1996 -56% -58% -58% Value of trade carried, $billion 5,441 5,934 6,243 % change over year Value of tourism spend, $billion 671 711 776 % change over year Supply chain jobs, million % change over year Supply chain GVA, $ trillion % change over year Worldwide AIRLINE INDUSTRY 2016 2017 2018 Tax revenues.
10 $billion 117 126 136 % change over year % GVA # of ticket taxes 234 236 239 % of countries requiring full visas 58 58 58 $/RTK in 2014US$Number of unique city-pairsUnique city-pairs and real transport costsUnique city-pairsReal transport costs405060708090100110120130140 35 40 45 50 55 60 65 70 7520002002200420062008201020122014201620 18$ billionMillionTax revenues and global supply chain jobs supportedSupply chain jobs supportedTax revenues 2017 End-year report 3 CAPITAL PROVIDERS Debt providers to the AIRLINE INDUSTRY are well rewarded for their capital, usually invested with the security of a very mobile aircraft asset to back it.